OPEN-SOURCE SCRIPT
US Party Rule Indicator
**Here's a description you can use for the indicator:**
**US Party Rule Indicator**
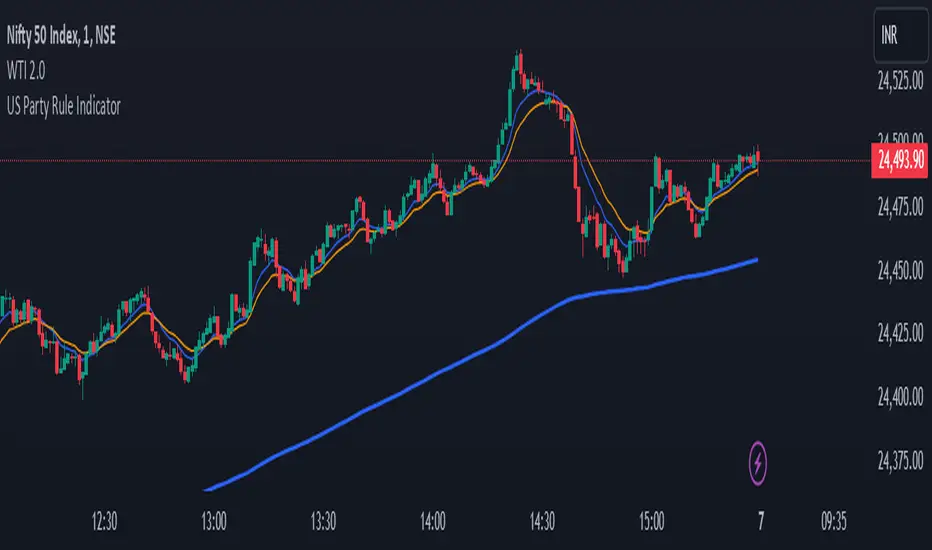
This indicator visually represents the political party in power in the United States over a specified period. It overlays a colored 200-day Exponential Moving Average (EMA) on the chart. The color of the EMA changes to reflect the ruling party, providing a visual representation of political influence on market trends.
**Key Features:**
- **Dynamic Color-Coded EMA:** The 200-EMA changes color to indicate the party in power (Red for Republican, Blue for Democrat).
- **Clear Visual Representation:** The colored EMA provides an easy-to-understand visual cue for identifying periods of different political parties.
- **Historical Context:** By analyzing the historical data, you can gain insights into potential correlations between party rule and market trends.
**How to Use:**
1. **Add the Indicator:** Add the "US Party Rule Indicator" to your chart.
2. **Interpret the Color:** The color of the 200-EMA indicates the ruling party at that time.
3. **Analyze Market Trends:** Use the indicator to identify potential correlations between political events and market movements.
**Note:** This indicator is for informational purposes only and should not be used as the sole basis for investment decisions. Always conduct thorough research and consider consulting with a financial advisor.
**US Party Rule Indicator**
This indicator visually represents the political party in power in the United States over a specified period. It overlays a colored 200-day Exponential Moving Average (EMA) on the chart. The color of the EMA changes to reflect the ruling party, providing a visual representation of political influence on market trends.
**Key Features:**
- **Dynamic Color-Coded EMA:** The 200-EMA changes color to indicate the party in power (Red for Republican, Blue for Democrat).
- **Clear Visual Representation:** The colored EMA provides an easy-to-understand visual cue for identifying periods of different political parties.
- **Historical Context:** By analyzing the historical data, you can gain insights into potential correlations between party rule and market trends.
**How to Use:**
1. **Add the Indicator:** Add the "US Party Rule Indicator" to your chart.
2. **Interpret the Color:** The color of the 200-EMA indicates the ruling party at that time.
3. **Analyze Market Trends:** Use the indicator to identify potential correlations between political events and market movements.
**Note:** This indicator is for informational purposes only and should not be used as the sole basis for investment decisions. Always conduct thorough research and consider consulting with a financial advisor.
오픈 소스 스크립트
트레이딩뷰의 진정한 정신에 따라, 이 스크립트의 작성자는 이를 오픈소스로 공개하여 트레이더들이 기능을 검토하고 검증할 수 있도록 했습니다. 작성자에게 찬사를 보냅니다! 이 코드는 무료로 사용할 수 있지만, 코드를 재게시하는 경우 하우스 룰이 적용된다는 점을 기억하세요.
면책사항
해당 정보와 게시물은 금융, 투자, 트레이딩 또는 기타 유형의 조언이나 권장 사항으로 간주되지 않으며, 트레이딩뷰에서 제공하거나 보증하는 것이 아닙니다. 자세한 내용은 이용 약관을 참조하세요.
오픈 소스 스크립트
트레이딩뷰의 진정한 정신에 따라, 이 스크립트의 작성자는 이를 오픈소스로 공개하여 트레이더들이 기능을 검토하고 검증할 수 있도록 했습니다. 작성자에게 찬사를 보냅니다! 이 코드는 무료로 사용할 수 있지만, 코드를 재게시하는 경우 하우스 룰이 적용된다는 점을 기억하세요.
면책사항
해당 정보와 게시물은 금융, 투자, 트레이딩 또는 기타 유형의 조언이나 권장 사항으로 간주되지 않으며, 트레이딩뷰에서 제공하거나 보증하는 것이 아닙니다. 자세한 내용은 이용 약관을 참조하세요.