OPEN-SOURCE SCRIPT
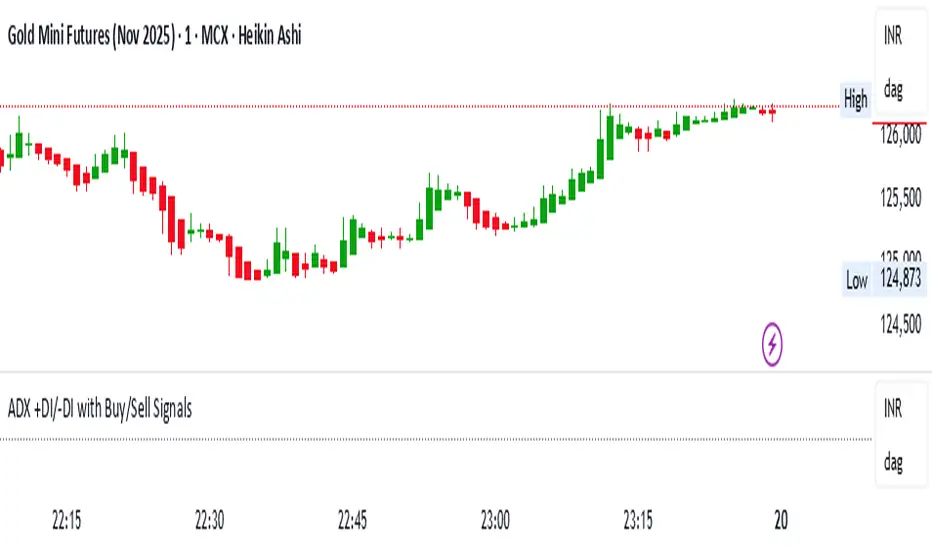
ADX +DI/-DI with Buy/Sell Signals
//version=5
indicator("ADX +DI/-DI with Buy/Sell Signals", overlay=true)
// Inputs
adxLength = input.int(14, "ADX Length")
threshold = input.float(25.0, "ADX Threshold")
// Directional Movement
upMove = ta.change(high)
downMove = -ta.change(low)
plusDM = (upMove > downMove and upMove > 0) ? upMove : 0.0
minusDM = (downMove > upMove and downMove > 0) ? downMove : 0.0
// True Range and Smoothed Values
tr = ta.rma(ta.tr, adxLength)
plusDI = 100 * ta.rma(plusDM, adxLength) / tr
minusDI = 100 * ta.rma(minusDM, adxLength) / tr
dx = 100 * math.abs(plusDI - minusDI) / (plusDI + minusDI)
adx = ta.rma(dx, adxLength)
// Buy/Sell Conditions
buySignal = ta.crossover(plusDI, minusDI) and adx > threshold
sellSignal = ta.crossover(minusDI, plusDI) and adx > threshold
// Plot Buy/Sell markers
plotshape(buySignal, title="BUY", location=location.belowbar,
color=color.new(color.lime, 0), style=shape.triangleup, size=size.large, text="BUY")
plotshape(sellSignal, title="SELL", location=location.abovebar,
color=color.new(color.red, 0), style=shape.triangledown, size=size.large, text="SELL")
// Optional ADX + DI lines (hidden by default)
plot(adx, title="ADX", color=color.yellow, linewidth=2, display=display.none)
plot(plusDI, title="+DI", color=color.green, display=display.none)
plot(minusDI, title="-DI", color=color.red, display=display.none)
hline(threshold, "ADX Threshold", color=color.gray, linestyle=hline.style_dotted)
// Alerts
alertcondition(buySignal, title="BUY Alert", message="ADX Buy Signal Triggered")
alertcondition(sellSignal, title="SELL Alert", message="ADX Sell Signal Triggered")
오픈 소스 스크립트
진정한 트레이딩뷰 정신에 따라 이 스크립트 작성자는 트레이더가 기능을 검토하고 검증할 수 있도록 오픈소스로 공개했습니다. 작성자에게 찬사를 보냅니다! 무료로 사용할 수 있지만 코드를 다시 게시할 경우 하우스 룰이 적용된다는 점을 기억하세요.
면책사항
이 정보와 게시물은 TradingView에서 제공하거나 보증하는 금융, 투자, 거래 또는 기타 유형의 조언이나 권고 사항을 의미하거나 구성하지 않습니다. 자세한 내용은 이용 약관을 참고하세요.
오픈 소스 스크립트
진정한 트레이딩뷰 정신에 따라 이 스크립트 작성자는 트레이더가 기능을 검토하고 검증할 수 있도록 오픈소스로 공개했습니다. 작성자에게 찬사를 보냅니다! 무료로 사용할 수 있지만 코드를 다시 게시할 경우 하우스 룰이 적용된다는 점을 기억하세요.
면책사항
이 정보와 게시물은 TradingView에서 제공하거나 보증하는 금융, 투자, 거래 또는 기타 유형의 조언이나 권고 사항을 의미하거나 구성하지 않습니다. 자세한 내용은 이용 약관을 참고하세요.