OPEN-SOURCE SCRIPT
Parabolic SAR BY CARLOZ
🔹 What is the Parabolic SAR?
The Parabolic SAR (developed by Welles Wilder) is a trend-following indicator used to identify potential entry and exit points in the market.
🔹 What does “SAR” mean?
SAR = Stop And Reverse.
It suggests where to place a stop loss and also indicates when to reverse a position (from long to short or short to long).
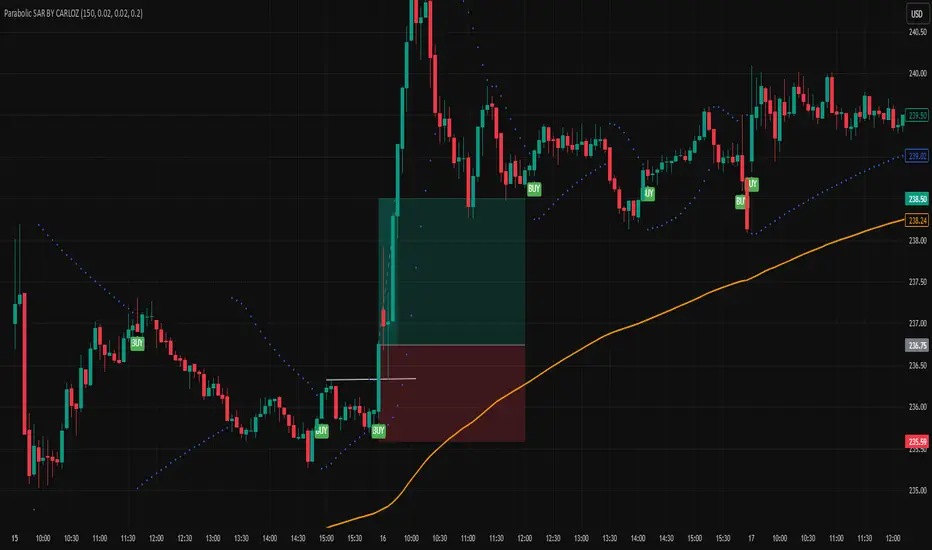
🔹 How does it look on the chart?
It appears as a series of dots above or below the price:
Dots below price → bullish signal (uptrend).
Dots above price → bearish signal (downtrend).
The Parabolic SAR (developed by Welles Wilder) is a trend-following indicator used to identify potential entry and exit points in the market.
🔹 What does “SAR” mean?
SAR = Stop And Reverse.
It suggests where to place a stop loss and also indicates when to reverse a position (from long to short or short to long).
🔹 How does it look on the chart?
It appears as a series of dots above or below the price:
Dots below price → bullish signal (uptrend).
Dots above price → bearish signal (downtrend).
오픈 소스 스크립트
트레이딩뷰의 진정한 정신에 따라, 이 스크립트의 작성자는 이를 오픈소스로 공개하여 트레이더들이 기능을 검토하고 검증할 수 있도록 했습니다. 작성자에게 찬사를 보냅니다! 이 코드는 무료로 사용할 수 있지만, 코드를 재게시하는 경우 하우스 룰이 적용된다는 점을 기억하세요.
면책사항
해당 정보와 게시물은 금융, 투자, 트레이딩 또는 기타 유형의 조언이나 권장 사항으로 간주되지 않으며, 트레이딩뷰에서 제공하거나 보증하는 것이 아닙니다. 자세한 내용은 이용 약관을 참조하세요.
오픈 소스 스크립트
트레이딩뷰의 진정한 정신에 따라, 이 스크립트의 작성자는 이를 오픈소스로 공개하여 트레이더들이 기능을 검토하고 검증할 수 있도록 했습니다. 작성자에게 찬사를 보냅니다! 이 코드는 무료로 사용할 수 있지만, 코드를 재게시하는 경우 하우스 룰이 적용된다는 점을 기억하세요.
면책사항
해당 정보와 게시물은 금융, 투자, 트레이딩 또는 기타 유형의 조언이나 권장 사항으로 간주되지 않으며, 트레이딩뷰에서 제공하거나 보증하는 것이 아닙니다. 자세한 내용은 이용 약관을 참조하세요.