OPEN-SOURCE SCRIPT
업데이트됨 EMA Cross [26,12]
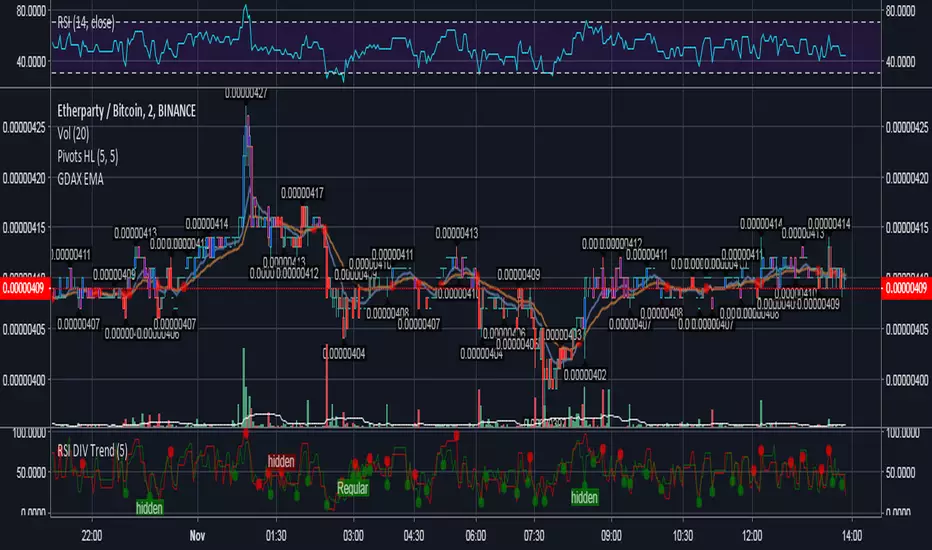
GDax EMA[26,12] with crossing highlight
릴리즈 노트
This indicator allow to show the EMA of the price similar to GDAX user interface.The purpose of this indicator is twice:
- Allowing the user to show a double EMA with the possibility to show when a EMA crossing happens.
- Showing in a more user friendly interface the GDAX ema line.
As a matter of fact is proven that those 2 EMA act as support/resistance during Bulls/Bear periods. The indicator works fine in the GDax timeframes, or rather 5m, 15m, 1h and daily excluding 3h and 6h as they're less used at the moment.
릴리즈 노트
This is the deprecated script오픈 소스 스크립트
트레이딩뷰의 진정한 정신에 따라, 이 스크립트의 작성자는 이를 오픈소스로 공개하여 트레이더들이 기능을 검토하고 검증할 수 있도록 했습니다. 작성자에게 찬사를 보냅니다! 이 코드는 무료로 사용할 수 있지만, 코드를 재게시하는 경우 하우스 룰이 적용된다는 점을 기억하세요.
면책사항
해당 정보와 게시물은 금융, 투자, 트레이딩 또는 기타 유형의 조언이나 권장 사항으로 간주되지 않으며, 트레이딩뷰에서 제공하거나 보증하는 것이 아닙니다. 자세한 내용은 이용 약관을 참조하세요.
오픈 소스 스크립트
트레이딩뷰의 진정한 정신에 따라, 이 스크립트의 작성자는 이를 오픈소스로 공개하여 트레이더들이 기능을 검토하고 검증할 수 있도록 했습니다. 작성자에게 찬사를 보냅니다! 이 코드는 무료로 사용할 수 있지만, 코드를 재게시하는 경우 하우스 룰이 적용된다는 점을 기억하세요.
면책사항
해당 정보와 게시물은 금융, 투자, 트레이딩 또는 기타 유형의 조언이나 권장 사항으로 간주되지 않으며, 트레이딩뷰에서 제공하거나 보증하는 것이 아닙니다. 자세한 내용은 이용 약관을 참조하세요.