OPEN-SOURCE SCRIPT
ATR Oscillator with Dots
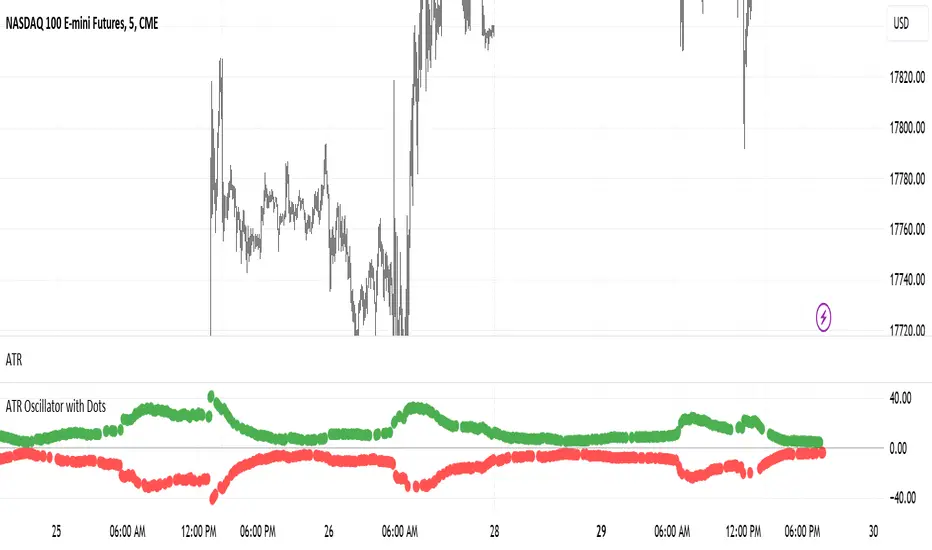
The ATR Oscillator with Dots utilizes the Average True Range (ATR), a traditional measure that captures the extent of an asset's price movements within a given timeframe. Rather than depicting these values in a continuous line, the ATR Oscillator represents them as discrete dots, colored according to the price movement direction: green for upward movements when the current close is higher than the previous, and red for downward movements when the current close is lower.
In terms of functionality, the key feature of this oscillator is how it visualizes volatility through the spacing of the dots. During periods of high market volatility, the shifts between red and green dots tend to occur more frequently and with greater disparity in their positioning along the oscillator’s axis. This indicates sharp price changes and high trading activity. Conversely, periods of market consolidation are characterized by fewer color changes and a more clustered arrangement of dots, reflecting less price movement and lower volatility.
Traders can leverage the insights from the ATR Oscillator with Dots to better understand the market's behavior. For instance, a tight clustering of dots around the zero line suggests a consolidation phase, where the price is relatively stable and may be preparing for a breakout. On the other hand, widely spaced dots alternating between red and green signify strong price movements, offering opportunities for traders to capitalize on trends or prepare for potential reversals.
Imagine a scenario where a trader is monitoring a currency pair in a fluctuating forex market. An observed increase in the frequency and gap of alternating red and green dots would suggest a rise in volatility, possibly triggered by economic news or events. This could be an optimal time for the trader to seek entry or exit points, aligning their strategy with the increased activity. Conversely, a reduction in the frequency and gap of dot changes could signal an impending consolidation phase, prompting the trader to adopt a more cautious approach or explore range-bound trading strategies.
Therefore, the ATR Oscillator with Dots not only simplifies the interpretation of volatility and price momentum through visual cues but also enriches the trader’s strategy by highlighting periods of high activity and consolidation. This tool can be crucial for making informed decisions, particularly in fast-moving or uncertain market conditions, and can be effectively paired with other indicators to confirm trends and refine trading tactics.
오픈 소스 스크립트
트레이딩뷰의 진정한 정신에 따라, 이 스크립트의 작성자는 이를 오픈소스로 공개하여 트레이더들이 기능을 검토하고 검증할 수 있도록 했습니다. 작성자에게 찬사를 보냅니다! 이 코드는 무료로 사용할 수 있지만, 코드를 재게시하는 경우 하우스 룰이 적용된다는 점을 기억하세요.
면책사항
해당 정보와 게시물은 금융, 투자, 트레이딩 또는 기타 유형의 조언이나 권장 사항으로 간주되지 않으며, 트레이딩뷰에서 제공하거나 보증하는 것이 아닙니다. 자세한 내용은 이용 약관을 참조하세요.
오픈 소스 스크립트
트레이딩뷰의 진정한 정신에 따라, 이 스크립트의 작성자는 이를 오픈소스로 공개하여 트레이더들이 기능을 검토하고 검증할 수 있도록 했습니다. 작성자에게 찬사를 보냅니다! 이 코드는 무료로 사용할 수 있지만, 코드를 재게시하는 경우 하우스 룰이 적용된다는 점을 기억하세요.
면책사항
해당 정보와 게시물은 금융, 투자, 트레이딩 또는 기타 유형의 조언이나 권장 사항으로 간주되지 않으며, 트레이딩뷰에서 제공하거나 보증하는 것이 아닙니다. 자세한 내용은 이용 약관을 참조하세요.