PROTECTED SOURCE SCRIPT
업데이트됨 Best Range (Day Trading)
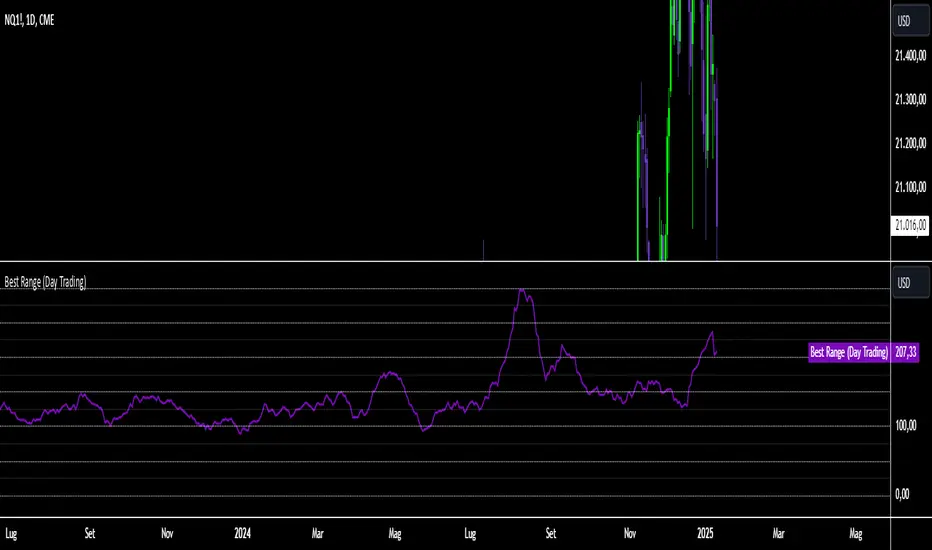
The indicator is based on a formula very similar to that of the ATR. The average volatility of the last candles (a value adjustable via inputs) is calculated, and this value is then divided (a value adjustable via inputs), providing a specific value in terms of RANGE.
Its use is very straightforward. It was primarily designed for stock indices (Nasdaq & SPX). When used on the DAILY timeframe, it provides the recommended RANGE value for day trading with structural logic.
Its goal is to offer a guiding value for setting the chart to a range-based view that is optimal and as effective as possible in identifying breakouts of specific levels, helping traders avoid false breakouts or misleading structures.
We can also observe a division of levels into quartiles (25, 50, 75, 100, 125...). This helps provide reference ranges, allowing the range to be used with rounded numbers.
For example, on Nasdaq, if the indicator set on DAILY provides a value between 200 and 250, then it is advisable to visualize the chart at 200 RANGE for a more aggressive approach or at 250 RANGE for a more conservative approach.
On SPX, which is less volatile, we use increments of 25. If the indicator gives a value between 25 and 50, then we use 25 for an aggressive approach and 50 for a conservative approach.
Obviously, this refers to FUTURES and the tick movements of MINI contracts.
릴리즈 노트
NEW VERSION The indicator is based on a formula very similar to that of the ATR. The average volatility of the last candles (a value adjustable via inputs) is calculated, and this value is then divided (a value adjustable via inputs), providing a specific value in terms of RANGE.
Its use is very straightforward. It was primarily designed for stock indices (Nasdaq & SPX). When used on the DAILY timeframe, it provides the recommended RANGE value for day trading with structural logic.
Its goal is to offer a guiding value for setting the chart to a range-based view that is optimal and as effective as possible in identifying breakouts of specific levels, helping traders avoid false breakouts or misleading structures.
We can also observe a division of levels into quartiles (25, 50, 75, 100, 125...). This helps provide reference ranges, allowing the range to be used with rounded numbers.
For example, on Nasdaq, if the indicator set on DAILY provides a value between 200 and 250, then it is advisable to visualize the chart at 200 RANGE for a more aggressive approach or at 250 RANGE for a more conservative approach.
On SPX, which is less volatile, we use increments of 25. If the indicator gives a value between 25 and 50, then we use 25 for an aggressive approach and 50 for a conservative approach.
Obviously, this refers to FUTURES and the tick movements of MINI contracts.
보호된 스크립트입니다
이 스크립트는 비공개 소스로 게시됩니다. 하지만 이를 자유롭게 제한 없이 사용할 수 있습니다 – 자세한 내용은 여기에서 확인하세요.
면책사항
해당 정보와 게시물은 금융, 투자, 트레이딩 또는 기타 유형의 조언이나 권장 사항으로 간주되지 않으며, 트레이딩뷰에서 제공하거나 보증하는 것이 아닙니다. 자세한 내용은 이용 약관을 참조하세요.
보호된 스크립트입니다
이 스크립트는 비공개 소스로 게시됩니다. 하지만 이를 자유롭게 제한 없이 사용할 수 있습니다 – 자세한 내용은 여기에서 확인하세요.
면책사항
해당 정보와 게시물은 금융, 투자, 트레이딩 또는 기타 유형의 조언이나 권장 사항으로 간주되지 않으며, 트레이딩뷰에서 제공하거나 보증하는 것이 아닙니다. 자세한 내용은 이용 약관을 참조하세요.