OPEN-SOURCE SCRIPT
Intraday Mean Reversion Main
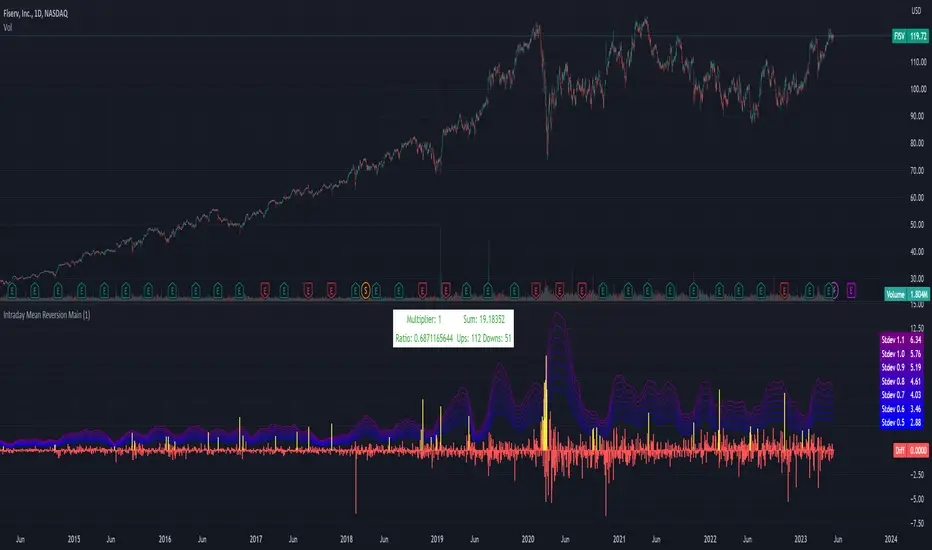
The Intraday Mean Reversion Indicator works well on certain stocks. It should be used for day trading stocks but need to be applied on the Day to Day timeframe.
The logic behind the indicator is that stocks that opens substantially lower than yesterdays close, very often bounces back during the day and closes higher than the open price, thus the name Intraday Mean reversal. The stock so to speak, reverses to the mean.
The indicator has 7 levels to choose from:
0.5 * standard deviation
0.6 * standard deviation
0.7 * standard deviation
0.8 * standard deviation
0.9 * standard deviation
1.0 * standard deviation
1.1 * standard deviation
The script can easily be modified to test other levels as well, but according to my experience these levels work the best.
The info box shows the performance of one of these levels, chosen by the user.
Every Yellow bar in the graph shows a buy signal. That is: The stocks open is substantially lower (0.5 - 1.1 standard deviations) than yesterdays close. This means we have a buy signal.
The Multiplier shows which multiplier is chosen, the sum shows the profit following the strategy if ONE stock is bought on every buy signal. The Ratio shows the ratio between winning and losing trades if we followed the strategy historically.
We want to find stocks that have a high ratio and a positive sum. That is More Ups than downs. A ratio over 0.5 is good, but of course we want a margin of safety so, 0.75 is a better choice but harder to find.
If we find a stock that meets our criteria then the strategy will be to buy as early as possible on the open, and sell as close as possible on the close!
오픈 소스 스크립트
트레이딩뷰의 진정한 정신에 따라, 이 스크립트의 작성자는 이를 오픈소스로 공개하여 트레이더들이 기능을 검토하고 검증할 수 있도록 했습니다. 작성자에게 찬사를 보냅니다! 이 코드는 무료로 사용할 수 있지만, 코드를 재게시하는 경우 하우스 룰이 적용된다는 점을 기억하세요.
면책사항
해당 정보와 게시물은 금융, 투자, 트레이딩 또는 기타 유형의 조언이나 권장 사항으로 간주되지 않으며, 트레이딩뷰에서 제공하거나 보증하는 것이 아닙니다. 자세한 내용은 이용 약관을 참조하세요.
오픈 소스 스크립트
트레이딩뷰의 진정한 정신에 따라, 이 스크립트의 작성자는 이를 오픈소스로 공개하여 트레이더들이 기능을 검토하고 검증할 수 있도록 했습니다. 작성자에게 찬사를 보냅니다! 이 코드는 무료로 사용할 수 있지만, 코드를 재게시하는 경우 하우스 룰이 적용된다는 점을 기억하세요.
면책사항
해당 정보와 게시물은 금융, 투자, 트레이딩 또는 기타 유형의 조언이나 권장 사항으로 간주되지 않으며, 트레이딩뷰에서 제공하거나 보증하는 것이 아닙니다. 자세한 내용은 이용 약관을 참조하세요.