OPEN-SOURCE SCRIPT
ÇOKLU ZAMAN TABLOSU
Merhaba dostlar,
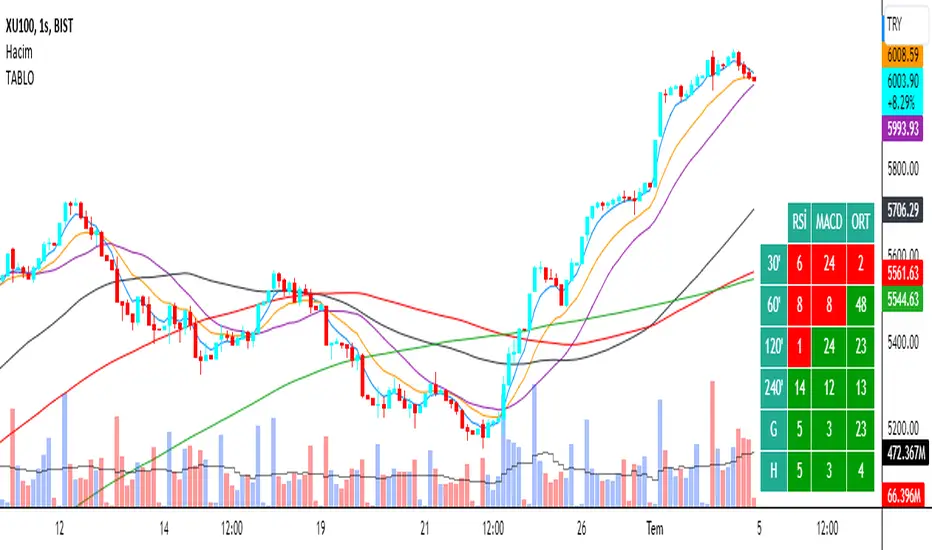
Sizler için yine güzel ve kullanışlı bir indikatör yayınlıyoruz. Bu indikatör sayesinde belirlediğiniz koşulların tüm zamanlardaki durumunu tablodan anlık olarak takip edebileceksiniz. Ayrıca koşulunuzun en son ne zaman gerçekleştiğini yine tabloda görebileceksiniz.
Tablodaki renklerin anlamları şu şekilde;
• Mavi 0 => son barda al sinyali gelmiştir.
• Siyah 0 => son barda sat sinyali gelmiştir.
• Yeşil => yazan değer bar önce al koşulu gerçekleşmiştir.
• Kırmızı => yazan değer bar önce sat koşulu gerçekleşmiştir.
Ayrıca kullanabileceğiniz türü ve değeri değiştirilebilir 6 adet ortalama mevcut.
İyi günlerde kullanın. Teşekkür etmek isterseniz çevrenizdeki bir çift gözü mutlu etmeniz yeterli.
-----------------------------------------------------------------------------------------------------------------------------------------------------------------------------------
Hello friends,
we are once again presenting you a beautiful and useful indicator. With this indicator, you will be able to instantly track the status of the conditions you have set in the table throughout all time periods. Additionally, you will be able to see when your condition was last met in the table.
The meanings of the colors in the table are as follows:
• Blue 0 => Buy signal occurred on the last bar.
• Black 0 => Sell signal occurred on the last bar.
• Green => The value indicated that the buy condition was met earlier in the bar.
• Red => The value indicated that the sell condition was met earlier in the bar.
Furthermore, there are 6 adjustable types of averages that you can use.
Use it in good days. If you wish to show your appreciation, simply make someone's eyes around you happy.
오픈 소스 스크립트
트레이딩뷰의 진정한 정신에 따라, 이 스크립트의 작성자는 이를 오픈소스로 공개하여 트레이더들이 기능을 검토하고 검증할 수 있도록 했습니다. 작성자에게 찬사를 보냅니다! 이 코드는 무료로 사용할 수 있지만, 코드를 재게시하는 경우 하우스 룰이 적용된다는 점을 기억하세요.
면책사항
해당 정보와 게시물은 금융, 투자, 트레이딩 또는 기타 유형의 조언이나 권장 사항으로 간주되지 않으며, 트레이딩뷰에서 제공하거나 보증하는 것이 아닙니다. 자세한 내용은 이용 약관을 참조하세요.
오픈 소스 스크립트
트레이딩뷰의 진정한 정신에 따라, 이 스크립트의 작성자는 이를 오픈소스로 공개하여 트레이더들이 기능을 검토하고 검증할 수 있도록 했습니다. 작성자에게 찬사를 보냅니다! 이 코드는 무료로 사용할 수 있지만, 코드를 재게시하는 경우 하우스 룰이 적용된다는 점을 기억하세요.
면책사항
해당 정보와 게시물은 금융, 투자, 트레이딩 또는 기타 유형의 조언이나 권장 사항으로 간주되지 않으며, 트레이딩뷰에서 제공하거나 보증하는 것이 아닙니다. 자세한 내용은 이용 약관을 참조하세요.