OPEN-SOURCE SCRIPT
Volume Stack Emojis

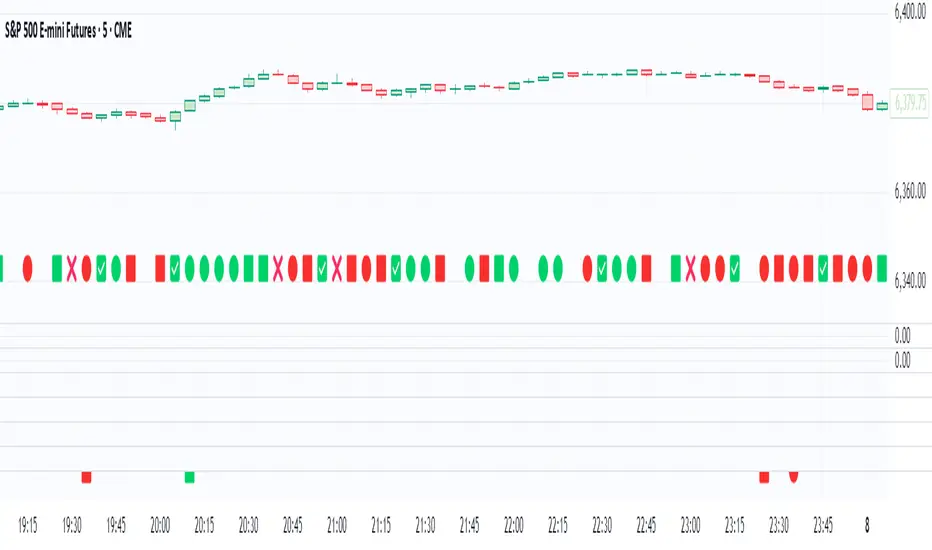
Volume Stack visualizes market bias and momentum for each candle using intuitive emojis in a dedicated bottom pane, keeping your main price chart clean and focused. The indicator analyzes where price closes within each bar’s range to estimate bullish or bearish pressure and highlights key momentum shifts.
Features:
Bullish and Bearish States:
🟩 Green square: Normal bullish candle
🟥 Red square: Normal bearish candle
Strong Bullish/Bearish:
🟢 Green circle: Strong bullish (close near high)
🔴 Red circle: Strong bearish (close near low)
Critical Transitions:
✅ Green checkmark: Bearish → strong bullish (momentum reversal up)
❌ Red cross: Bullish → strong bearish (momentum reversal down)
Easy Visual Scanning:
Emojis plotted in the indicator’s own pane for rapid pattern recognition and clean workflow.
No overlays:
Keeps all symbols off the main price pane.
How it works:
For each candle, the indicator calculates the percentage distance of the close price within the high/low range, then classifies and marks:
Normal bullish/bearish: Basic directional bias
Strong signals: Close is at least 75% toward the high (bullish) or low (bearish)
Transitions: Detects when the market suddenly flips from bullish to strong bearish (❌), or bearish to strong bullish (✅), pinpointing possible inflection points.
This indicator is ideal for traders who want a simple, non-intrusive visualization of intrabar momentum and key reversals—making trend reading and market sentiment effortless.
오픈 소스 스크립트
트레이딩뷰의 진정한 정신에 따라, 이 스크립트의 작성자는 이를 오픈소스로 공개하여 트레이더들이 기능을 검토하고 검증할 수 있도록 했습니다. 작성자에게 찬사를 보냅니다! 이 코드는 무료로 사용할 수 있지만, 코드를 재게시하는 경우 하우스 룰이 적용된다는 점을 기억하세요.
면책사항
해당 정보와 게시물은 금융, 투자, 트레이딩 또는 기타 유형의 조언이나 권장 사항으로 간주되지 않으며, 트레이딩뷰에서 제공하거나 보증하는 것이 아닙니다. 자세한 내용은 이용 약관을 참조하세요.
오픈 소스 스크립트
트레이딩뷰의 진정한 정신에 따라, 이 스크립트의 작성자는 이를 오픈소스로 공개하여 트레이더들이 기능을 검토하고 검증할 수 있도록 했습니다. 작성자에게 찬사를 보냅니다! 이 코드는 무료로 사용할 수 있지만, 코드를 재게시하는 경우 하우스 룰이 적용된다는 점을 기억하세요.
면책사항
해당 정보와 게시물은 금융, 투자, 트레이딩 또는 기타 유형의 조언이나 권장 사항으로 간주되지 않으며, 트레이딩뷰에서 제공하거나 보증하는 것이 아닙니다. 자세한 내용은 이용 약관을 참조하세요.