INVITE-ONLY SCRIPT
업데이트됨 MFITradeWaves
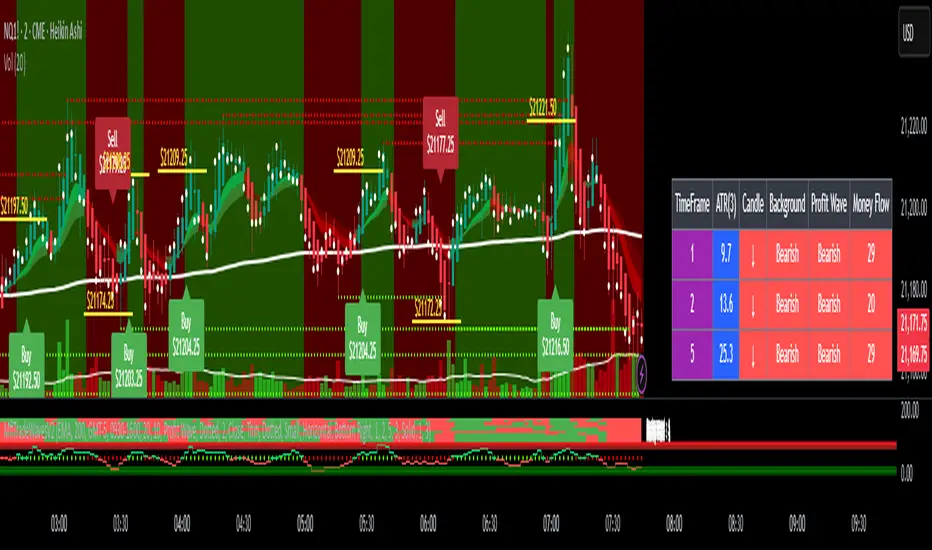
Core Functionalities
Buy & Sell Signals:
Generates buy and sell signals based on:
Trend direction (up or down).
Money Flow Index (MFI) values.
Confirmation of bullish or bearish candle structures.
Alerts can be configured for buy/sell conditions.
Includes customizable signal coloring and optional real-time price labels.
Profit Target System:
Automatically calculates and plots profit target lines based on a user-defined tick/pip/cents value.
Includes settings for:
Maximum number of target lines displayed.
Customizable colors and styles.
Background Trend Highlighting:
Dynamically changes the background color to reflect:
Bullish trends (e.g., greenish shades).
Bearish trends (e.g., reddish shades).
Candle Coloring:
Customizes candle colors based on:
Profit wave conditions (fast EMA above/below the price).
Trend conditions (bullish/bearish).
Offers full control over colors and settings.
Support and Resistance Lines:
Automatically identifies and plots pivot high/low levels for support/resistance.
Includes:
Configurable line styles, colors, and widths.
Automatic adjustment when lines are touched by price or closed beyond.
Limits on the number of support/resistance lines plotted.
Profit Waves:
Visualizes profit-taking opportunities using three EMA levels:
Fast EMA (8-period), Medium EMA (13-period), and Slow EMA (21-period).
Provides:
Color-coded zones for bullish and bearish conditions.
Fill effects between EMAs to indicate directional strength.
Linear Regression Channel:
Optional price channel feature with:
Configurable sensitivity.
Top/bottom channel colors.
Extending lines left/right.
Money Flow Index Dashboard:
Plots the MFI oscillator and its corresponding trend (bullish/bearish).
Displays overbought/oversold zones with customizable gradients.
Includes trend-switch dots for quick visual interpretation.
Real Price Line:
Adds a real-time price line with options for:
Line styles (solid, dashed, dotted).
Close-price dots for further clarity.
Signal Alerts:
Provides alert conditions for:
Buy/sell signals.
Support/resistance breakouts.
Alerts can be easily modified for specific scenarios.
Dashboard Integration:
Displays key metrics in a dashboard format:
Buy/Sell signals.
MFI value and trend.
Trend-switch dots.
Overbought/Oversold zones.
Inputs & Settings
Signal Settings:
Enable/Disable buy & sell signals.
Signal colors and optional price display.
Chop filter to reduce signals in ranging markets.
Profit Settings:
Enable profit target lines and wave visuals.
Customize colors, line counts, and target values.
Trend Background:
Highlight bullish/bearish trends with customizable colors.
Candle Coloring:
Candle colors can be set to reflect either:
Profit waves.
Trend direction.
Support/Resistance:
Enable dynamic support/resistance levels.
Customize line colors, styles, and max line count.
Real Price Line:
Display real-time price lines with dots for close prices.
Linear Regression Channel:
Enable/disable regression channels for price movement visualization.
Dashboard:
Enable buy/sell signals, trend-switch dots, and MFI trends.
How It Works
Trend Calculation:
Based on trend up/down levels, with adjustments using ATR multipliers.
Background changes based on whether the price is above or below trend lines.
Buy/Sell Logic:
Buy condition:
Bullish trend.
Strong bullish candles.
MFI above a threshold.
Sell condition:
Bearish trend.
Strong bearish candles.
MFI below a threshold.
Profit Targets:
Calculates target levels dynamically for every buy/sell signal.
Support/Resistance:
Detects pivot highs/lows and extends lines until touched.
Profit Waves:
Uses three EMA levels to visualize potential price waves.
Linear Regression:
Tracks the price movement across regression channels.
Alerts:
Alerts are triggered when conditions for buy/sell are met.
릴리즈 노트
MFI TRADE WAVES NEW UPDATE초대 전용 스크립트
이 스크립트는 작성자가 승인한 사용자만 접근할 수 있습니다. 사용하려면 요청 후 승인을 받아야 하며, 일반적으로 결제 후에 허가가 부여됩니다. 자세한 내용은 아래 작성자의 안내를 따르거나 MonicaPropTraderz에게 직접 문의하세요.
이 비공개 초대 전용 스크립트는 스크립트 모더레이터의 검토를 거치지 않았으며, 하우스 룰 준수 여부는 확인되지 않았습니다. 트레이딩뷰는 스크립트의 작동 방식을 충분히 이해하고 작성자를 완전히 신뢰하지 않는 이상, 해당 스크립트에 비용을 지불하거나 사용하는 것을 권장하지 않습니다. 커뮤니티 스크립트에서 무료 오픈소스 대안을 찾아보실 수도 있습니다.
작성자 지시 사항
Join Discord for access or dm) discord its faster)
free access https://discord.gg/aZsqNAtUAS
MonicaPropTraderz
면책사항
해당 정보와 게시물은 금융, 투자, 트레이딩 또는 기타 유형의 조언이나 권장 사항으로 간주되지 않으며, 트레이딩뷰에서 제공하거나 보증하는 것이 아닙니다. 자세한 내용은 이용 약관을 참조하세요.
초대 전용 스크립트
이 스크립트는 작성자가 승인한 사용자만 접근할 수 있습니다. 사용하려면 요청 후 승인을 받아야 하며, 일반적으로 결제 후에 허가가 부여됩니다. 자세한 내용은 아래 작성자의 안내를 따르거나 MonicaPropTraderz에게 직접 문의하세요.
이 비공개 초대 전용 스크립트는 스크립트 모더레이터의 검토를 거치지 않았으며, 하우스 룰 준수 여부는 확인되지 않았습니다. 트레이딩뷰는 스크립트의 작동 방식을 충분히 이해하고 작성자를 완전히 신뢰하지 않는 이상, 해당 스크립트에 비용을 지불하거나 사용하는 것을 권장하지 않습니다. 커뮤니티 스크립트에서 무료 오픈소스 대안을 찾아보실 수도 있습니다.
작성자 지시 사항
Join Discord for access or dm) discord its faster)
free access https://discord.gg/aZsqNAtUAS
MonicaPropTraderz
면책사항
해당 정보와 게시물은 금융, 투자, 트레이딩 또는 기타 유형의 조언이나 권장 사항으로 간주되지 않으며, 트레이딩뷰에서 제공하거나 보증하는 것이 아닙니다. 자세한 내용은 이용 약관을 참조하세요.