OPEN-SOURCE SCRIPT
Normalized MACD with RSI [bkeevil]
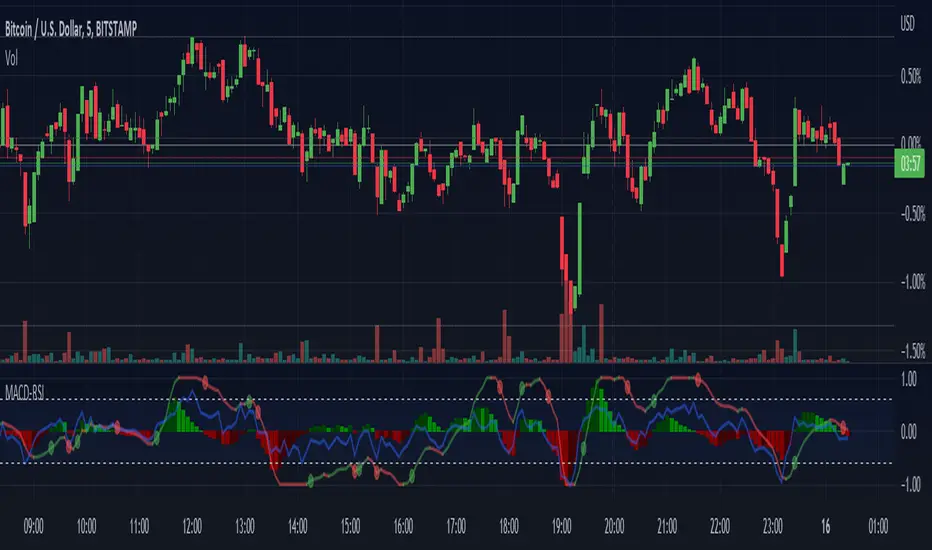
This indicator normalizes the MACD and RSI indicators to a range between -1.0 and 1.0 so they can be displayed together on the same chart to save screen real-estate.
While the MACD is a good indicator to detect trend changes, in some circumstances (such as a sideways range market) it can give false signals. The MACD is more likely to give a false signal when the RSI indicator is close to the centerline than if the RSI is signaling an overbought or oversold condition. Thus the RSI indicator and MACD indicator are commonly used together.
I have included a few features found in other MACD indicators that I have found helpful:
The MACD signal line is hidden it by default as the information it contains is redundant. Hiding the signal line makes the indicator less busy.
While the MACD is a good indicator to detect trend changes, in some circumstances (such as a sideways range market) it can give false signals. The MACD is more likely to give a false signal when the RSI indicator is close to the centerline than if the RSI is signaling an overbought or oversold condition. Thus the RSI indicator and MACD indicator are commonly used together.
I have included a few features found in other MACD indicators that I have found helpful:
- MACD line changes color if it is rising or falling
- Dots at the MACD line to signal crossovers
The MACD signal line is hidden it by default as the information it contains is redundant. Hiding the signal line makes the indicator less busy.
오픈 소스 스크립트
트레이딩뷰의 진정한 정신에 따라, 이 스크립트의 작성자는 이를 오픈소스로 공개하여 트레이더들이 기능을 검토하고 검증할 수 있도록 했습니다. 작성자에게 찬사를 보냅니다! 이 코드는 무료로 사용할 수 있지만, 코드를 재게시하는 경우 하우스 룰이 적용된다는 점을 기억하세요.
면책사항
해당 정보와 게시물은 금융, 투자, 트레이딩 또는 기타 유형의 조언이나 권장 사항으로 간주되지 않으며, 트레이딩뷰에서 제공하거나 보증하는 것이 아닙니다. 자세한 내용은 이용 약관을 참조하세요.
오픈 소스 스크립트
트레이딩뷰의 진정한 정신에 따라, 이 스크립트의 작성자는 이를 오픈소스로 공개하여 트레이더들이 기능을 검토하고 검증할 수 있도록 했습니다. 작성자에게 찬사를 보냅니다! 이 코드는 무료로 사용할 수 있지만, 코드를 재게시하는 경우 하우스 룰이 적용된다는 점을 기억하세요.
면책사항
해당 정보와 게시물은 금융, 투자, 트레이딩 또는 기타 유형의 조언이나 권장 사항으로 간주되지 않으며, 트레이딩뷰에서 제공하거나 보증하는 것이 아닙니다. 자세한 내용은 이용 약관을 참조하세요.