OPEN-SOURCE SCRIPT
AT Ratio
AT Ratio
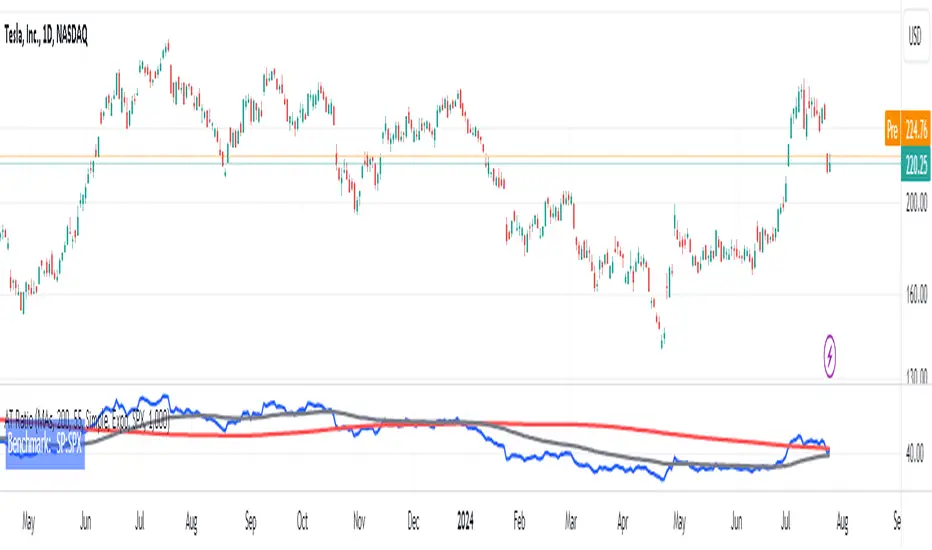
This indicator plots a ratio chart of 2 symbols, calculated as symbol1/symbol2.
The current chart symbol is used as symbol1.
A ratio chart allows to determine the relative strength of an asset compared to another asset.
It can be used for example to compare two stocks or a stock to its benchmark index, thus showing,
- if a stock has strength on its own (climbing ratio chart)
- if a stock just moves with the index (sideways ratio chart)
- if a stock is weaker than the index (falling ratio chart)
Inputs:
Style:
Plain: Only the ratio chart is plotted
MAs: Additional Moving Averages of the ratio chart are plotted
Perdiod Long: The period for the long MA
Perdiod Short: The period for the long MA
MA Type Long:
Simple: A simple MA is used
Expo: An exponential MA is used
MA Type Short:
Simple: A simple MA is used
Expo: An exponential MA is used
Ratio Symbol: The symbol to be used for symbol2
Factor: A factor the ratio value is multiplied by
Open-source script
오픈 소스 스크립트
트레이딩뷰의 진정한 정신에 따라, 이 스크립트의 작성자는 이를 오픈소스로 공개하여 트레이더들이 기능을 검토하고 검증할 수 있도록 했습니다. 작성자에게 찬사를 보냅니다! 이 코드는 무료로 사용할 수 있지만, 코드를 재게시하는 경우 하우스 룰이 적용된다는 점을 기억하세요.
면책사항
해당 정보와 게시물은 금융, 투자, 트레이딩 또는 기타 유형의 조언이나 권장 사항으로 간주되지 않으며, 트레이딩뷰에서 제공하거나 보증하는 것이 아닙니다. 자세한 내용은 이용 약관을 참조하세요.
오픈 소스 스크립트
트레이딩뷰의 진정한 정신에 따라, 이 스크립트의 작성자는 이를 오픈소스로 공개하여 트레이더들이 기능을 검토하고 검증할 수 있도록 했습니다. 작성자에게 찬사를 보냅니다! 이 코드는 무료로 사용할 수 있지만, 코드를 재게시하는 경우 하우스 룰이 적용된다는 점을 기억하세요.
면책사항
해당 정보와 게시물은 금융, 투자, 트레이딩 또는 기타 유형의 조언이나 권장 사항으로 간주되지 않으며, 트레이딩뷰에서 제공하거나 보증하는 것이 아닙니다. 자세한 내용은 이용 약관을 참조하세요.