PROTECTED SOURCE SCRIPT
Drawdown % + STD Bands: Log-Scale Macro Tool
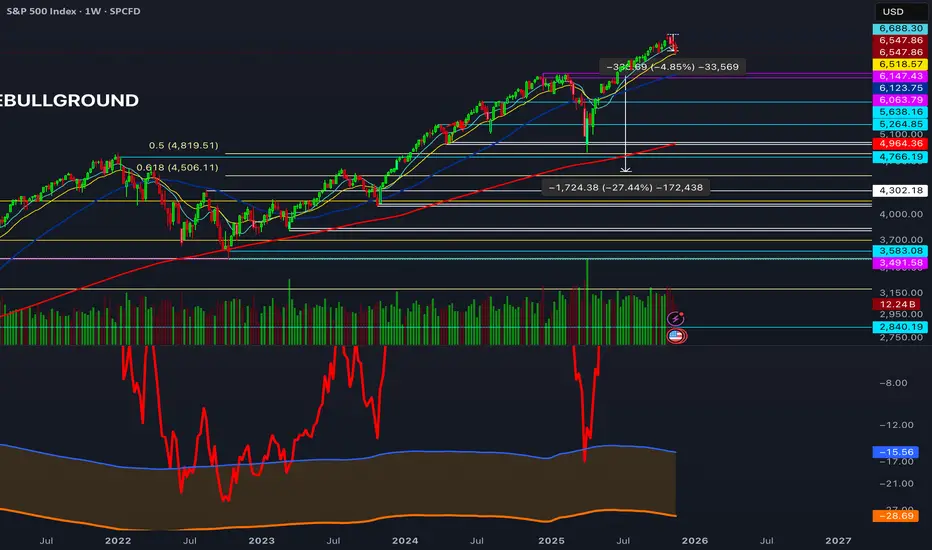
Description: The exact indicator big-macro accounts use: tracks real-time drawdown from the rolling 252-period peak, then plots -1σ (blue) and -2σ (orange) bands on a clean percent scale. Built for weekly charts-shows if a stock, index, or crypto is statistically cheap (hit -1σ) or generational-buy territory (-2σ). Works flawlessly on SPX, Nasdaq, Bitcoin, Gold, Tesla... anything. How to Use (read it aloud like a voice memo): 1. Slap this under any chart, set to weekly timeframe . 2. Flip the price pane to log scale -zero negotiations. 3. Watch the thick red line: • Hovering 0 %? Bullish noise, chill. • Kissing blue (-10 % to -25 %)? Start loading-happens every 1-2 years. • Touching orange (-30 %+)? Panic sale finished. Buy like rent money's burning a hole. 4. Zoom out five-ten years; monthly works too if you want lazy vibes. Daily? Trash-too twitchy. Pro tip: Name your watchlist Panic Plays, drop this in, and ping me when MELI or GOOGL hits orange. I'll confirm if it's actually stupid-cheap.
보호된 스크립트입니다
이 스크립트는 비공개 소스로 게시됩니다. 하지만 이를 자유롭게 제한 없이 사용할 수 있습니다 – 자세한 내용은 여기에서 확인하세요.
면책사항
해당 정보와 게시물은 금융, 투자, 트레이딩 또는 기타 유형의 조언이나 권장 사항으로 간주되지 않으며, 트레이딩뷰에서 제공하거나 보증하는 것이 아닙니다. 자세한 내용은 이용 약관을 참조하세요.
보호된 스크립트입니다
이 스크립트는 비공개 소스로 게시됩니다. 하지만 이를 자유롭게 제한 없이 사용할 수 있습니다 – 자세한 내용은 여기에서 확인하세요.
면책사항
해당 정보와 게시물은 금융, 투자, 트레이딩 또는 기타 유형의 조언이나 권장 사항으로 간주되지 않으며, 트레이딩뷰에서 제공하거나 보증하는 것이 아닙니다. 자세한 내용은 이용 약관을 참조하세요.