OPEN-SOURCE SCRIPT
Moving Average Deviations
Inputs:
MA Length = select the length period of the moving average
Timeframe = select the timeframe you want the indicator to operate on
Moving Average Type = select the type of moving average you want to use- most common ones are listed
Lookback = The histogram comparison period. A longer lookback will give fewer signals.
"Compare this reading to the past [Lookback #] of readings"
Threshold = The percent change in reading required compared to the lookback period to paint a bar dark red or dark green. A smaller threshold gives fewer readings.
"Compare this reading and only look for the top [Threshold %] of moves"
This moving average creates a histogram plot of the percent deviation from a specified moving average. Above paints faint green, and below paints faint red.
Dark red/green are painted in the direction of the move when the move is above the Threshold % when compared to the past Lookback length.
This script is optimally used to countertrend. It paints a good place to buy the dip or sell the rip given extensions-- different variant of overbought/oversold.
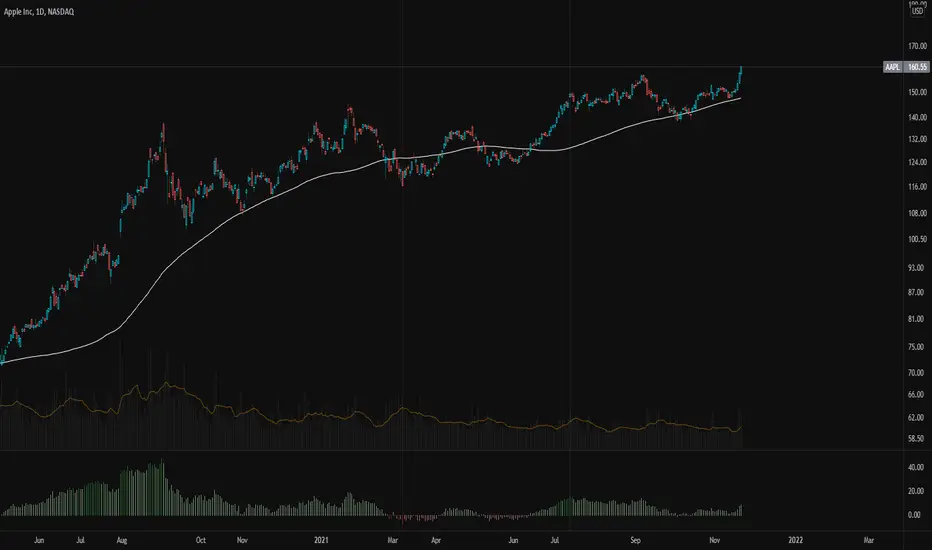
In this example, I used the 100 SMA, 100 period lookback, and a threshold of 7% [Default].
MA Length = select the length period of the moving average
Timeframe = select the timeframe you want the indicator to operate on
Moving Average Type = select the type of moving average you want to use- most common ones are listed
Lookback = The histogram comparison period. A longer lookback will give fewer signals.
"Compare this reading to the past [Lookback #] of readings"
Threshold = The percent change in reading required compared to the lookback period to paint a bar dark red or dark green. A smaller threshold gives fewer readings.
"Compare this reading and only look for the top [Threshold %] of moves"
This moving average creates a histogram plot of the percent deviation from a specified moving average. Above paints faint green, and below paints faint red.
Dark red/green are painted in the direction of the move when the move is above the Threshold % when compared to the past Lookback length.
This script is optimally used to countertrend. It paints a good place to buy the dip or sell the rip given extensions-- different variant of overbought/oversold.
In this example, I used the 100 SMA, 100 period lookback, and a threshold of 7% [Default].
오픈 소스 스크립트
트레이딩뷰의 진정한 정신에 따라, 이 스크립트의 작성자는 이를 오픈소스로 공개하여 트레이더들이 기능을 검토하고 검증할 수 있도록 했습니다. 작성자에게 찬사를 보냅니다! 이 코드는 무료로 사용할 수 있지만, 코드를 재게시하는 경우 하우스 룰이 적용된다는 점을 기억하세요.
면책사항
해당 정보와 게시물은 금융, 투자, 트레이딩 또는 기타 유형의 조언이나 권장 사항으로 간주되지 않으며, 트레이딩뷰에서 제공하거나 보증하는 것이 아닙니다. 자세한 내용은 이용 약관을 참조하세요.
오픈 소스 스크립트
트레이딩뷰의 진정한 정신에 따라, 이 스크립트의 작성자는 이를 오픈소스로 공개하여 트레이더들이 기능을 검토하고 검증할 수 있도록 했습니다. 작성자에게 찬사를 보냅니다! 이 코드는 무료로 사용할 수 있지만, 코드를 재게시하는 경우 하우스 룰이 적용된다는 점을 기억하세요.
면책사항
해당 정보와 게시물은 금융, 투자, 트레이딩 또는 기타 유형의 조언이나 권장 사항으로 간주되지 않으며, 트레이딩뷰에서 제공하거나 보증하는 것이 아닙니다. 자세한 내용은 이용 약관을 참조하세요.