OPEN-SOURCE SCRIPT
업데이트됨 Price Ratio Indicator [ChartPrime]
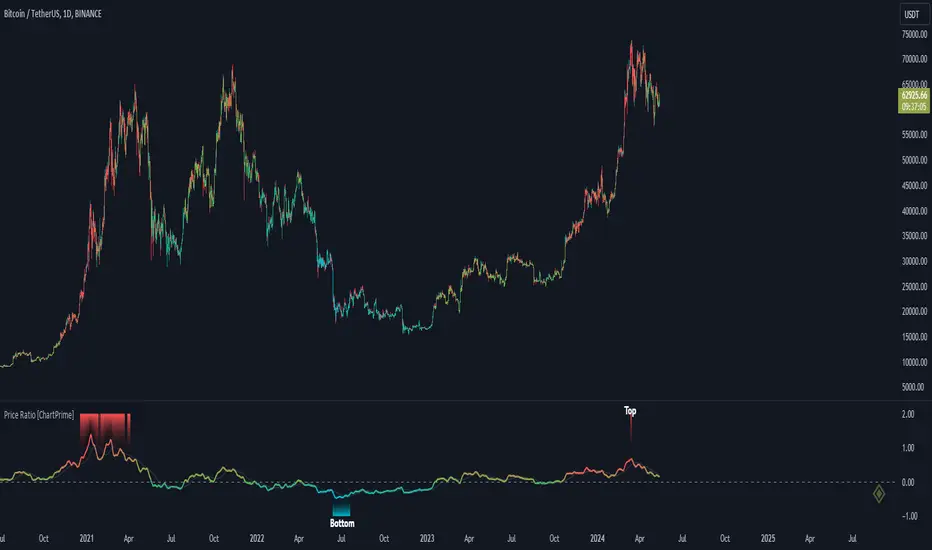
The Price Ratio Indicator is a versatile tool designed to analyze the relationship between the price of an asset and its moving average. It helps traders identify overbought and oversold conditions in the market, as well as potential trend reversals.
◈ User Inputs:
◈ Indicator Calculation:
The indicator calculates the ratio between the price of the asset and the selected moving average, subtracts 1 from the ratio, and then smooths the result using the chosen signal line length.
Pine Script®
◈ Visualization:
MA type HMA gives faster changes of the indicator (Each MA has its own specifics):

MA type TEMA:

◈ Additional Features:
A symbol displayed at the bottom right corner of the chart provides a quick visual reference to the current state of the indicator, with color intensity indicating the strength of the ratio.

Overall, the Price Ratio Indicator offers traders valuable insights into price dynamics and helps them make informed trading decisions based on the relationship between price and moving averages. Adjusting the input parameters allows for customization according to individual trading preferences and market conditions.
◈ User Inputs:
- MA Length: Specifies the length of the moving average used in the calculation.
- MA Type Fast: Allows users to choose from various types of moving averages such as Exponential Moving Average (EMA), Simple Moving Average (SMA), Weighted Moving Average (WMA), Volume Weighted Moving Average (VWMA), Relative Moving Average (RMA), Double Exponential Moving Average (DEMA), Triple Exponential Moving Average (TEMA), Zero-Lag Exponential Moving Average (ZLEMA), and Hull Moving Average (HMA).
- Upper Level and Lower Level: Define the threshold levels for identifying overbought and oversold conditions.
- Signal Line Length: Determines the length of the signal line used for smoothing the indicator's values.
◈ Indicator Calculation:
The indicator calculates the ratio between the price of the asset and the selected moving average, subtracts 1 from the ratio, and then smooths the result using the chosen signal line length.
// 𝙄𝙉𝘿𝙄𝘾𝘼𝙏𝙊𝙍 𝘾𝘼𝙇𝘾𝙐𝙇𝘼𝙏𝙄𝙊𝙉𝙎
//@ Moving Average's Function
ma(src, ma_period, ma_type) =>
ma =
ma_type == 'EMA' ? ta.ema(src, ma_period) :
ma_type == 'SMA' ? ta.sma(src, ma_period) :
ma_type == 'WMA' ? ta.wma(src, ma_period) :
ma_type == 'VWMA' ? ta.vwma(src, ma_period) :
ma_type == 'RMA' ? ta.rma(src, ma_period) :
ma_type == 'DEMA' ? ta.ema(ta.ema(src, ma_period), ma_period) :
ma_type == 'TEMA' ? ta.ema(ta.ema(ta.ema(src, ma_period), ma_period), ma_period) :
ma_type == 'ZLEMA' ? ta.ema(src + src - src[math.round(ma_period / 2)], ma_period) :
ma_type == 'HMA' ? ta.hma(src, ma_period)
: na
ma
//@ Smooth of Source
src = math.sum(source, 5)/5
//@ Ratio Price / MA's
p_ratio = src / ma(src, ma_period, ma_type) - 1
◈ Visualization:
- The main plot displays the price ratio, with color gradients indicating the strength and direction of the ratio.
- The bar color changes dynamically based on the ratio, providing a visual representation of market conditions.
- Invisible Horizontal lines indicate the upper and lower threshold levels for overbought and oversold conditions.
- A signal line, smoothed using the specified length, helps identify trends and potential reversal points.
- High and low value regions are filled with color gradients, enhancing visualization of extreme price movements.
MA type HMA gives faster changes of the indicator (Each MA has its own specifics):
MA type TEMA:
◈ Additional Features:
A symbol displayed at the bottom right corner of the chart provides a quick visual reference to the current state of the indicator, with color intensity indicating the strength of the ratio.
Overall, the Price Ratio Indicator offers traders valuable insights into price dynamics and helps them make informed trading decisions based on the relationship between price and moving averages. Adjusting the input parameters allows for customization according to individual trading preferences and market conditions.
릴리즈 노트
The Price Ratio Indicator is a versatile tool designed to analyze the relationship between the price of an asset and its moving average. It helps traders identify overbought and oversold conditions in the market, as well as potential trend reversals.◈ User Inputs:
- MA Length: Specifies the length of the moving average used in the calculation.
- MA Type Fast: Allows users to choose from various types of moving averages such as Exponential Moving Average (EMA), Simple Moving Average (SMA), Weighted Moving Average (WMA), Volume Weighted Moving Average (VWMA), Relative Moving Average (RMA), Double Exponential Moving Average (DEMA), Triple Exponential Moving Average (TEMA), Zero-Lag Exponential Moving Average (ZLEMA), and Hull Moving Average (HMA).
- Upper Level and Lower Level: Define the threshold levels for identifying overbought and oversold conditions.
- Signal Line Length: Determines the length of the signal line used for smoothing the indicator's values.
◈ Indicator Calculation:
The indicator calculates the ratio between the price of the asset and the selected moving average, subtracts 1 from the ratio, and then smooths the result using the chosen signal line length.
// 𝙄𝙉𝘿𝙄𝘾𝘼𝙏𝙊𝙍 𝘾𝘼𝙇𝘾𝙐𝙇𝘼𝙏𝙄𝙊𝙉𝙎
//@ Moving Average's Function
ma(src, ma_period, ma_type) =>
ma =
ma_type == 'EMA' ? ta.ema(src, ma_period) :
ma_type == 'SMA' ? ta.sma(src, ma_period) :
ma_type == 'WMA' ? ta.wma(src, ma_period) :
ma_type == 'VWMA' ? ta.vwma(src, ma_period) :
ma_type == 'RMA' ? ta.rma(src, ma_period) :
ma_type == 'DEMA' ? ta.ema(ta.ema(src, ma_period), ma_period) :
ma_type == 'TEMA' ? ta.ema(ta.ema(ta.ema(src, ma_period), ma_period), ma_period) :
ma_type == 'ZLEMA' ? ta.ema(src + src - src[math.round(ma_period / 2)], ma_period) :
ma_type == 'HMA' ? ta.hma(src, ma_period)
: na
ma
//@ Smooth of Source
src = math.sum(source, 5)/5
//@ Ratio Price / MA's
p_ratio = src / ma(src, ma_period, ma_type) - 1
◈ Visualization:
- The main plot displays the price ratio, with color gradients indicating the strength and direction of the ratio.
- The bar color changes dynamically based on the ratio, providing a visual representation of market conditions.
- Invisible Horizontal lines indicate the upper and lower threshold levels for overbought and oversold conditions.
It is important to know that when changing an asset or timeframe, you must always adjust the range of levels: - A signal line, smoothed using the specified length, helps identify trends and potential reversal points.
- High and low value regions are filled with color gradients, enhancing visualization of extreme price movements.
MA type HMA gives faster changes of the indicator (Each MA has its own specifics):
MA type TEMA:
◈ Additional Features:
A symbol displayed at the bottom right corner of the chart provides a quick visual reference to the current state of the indicator, with color intensity indicating the strength of the ratio.
Overall, the Price Ratio Indicator offers traders valuable insights into price dynamics and helps them make informed trading decisions based on the relationship between price and moving averages. Adjusting the input parameters allows for customization according to individual trading preferences and market conditions.
릴리즈 노트
Normalization Range (No need to adjust levels when changing asset or timeframe)오픈 소스 스크립트
트레이딩뷰의 진정한 정신에 따라, 이 스크립트의 작성자는 이를 오픈소스로 공개하여 트레이더들이 기능을 검토하고 검증할 수 있도록 했습니다. 작성자에게 찬사를 보냅니다! 이 코드는 무료로 사용할 수 있지만, 코드를 재게시하는 경우 하우스 룰이 적용된다는 점을 기억하세요.
면책사항
해당 정보와 게시물은 금융, 투자, 트레이딩 또는 기타 유형의 조언이나 권장 사항으로 간주되지 않으며, 트레이딩뷰에서 제공하거나 보증하는 것이 아닙니다. 자세한 내용은 이용 약관을 참조하세요.
오픈 소스 스크립트
트레이딩뷰의 진정한 정신에 따라, 이 스크립트의 작성자는 이를 오픈소스로 공개하여 트레이더들이 기능을 검토하고 검증할 수 있도록 했습니다. 작성자에게 찬사를 보냅니다! 이 코드는 무료로 사용할 수 있지만, 코드를 재게시하는 경우 하우스 룰이 적용된다는 점을 기억하세요.
면책사항
해당 정보와 게시물은 금융, 투자, 트레이딩 또는 기타 유형의 조언이나 권장 사항으로 간주되지 않으며, 트레이딩뷰에서 제공하거나 보증하는 것이 아닙니다. 자세한 내용은 이용 약관을 참조하세요.