OPEN-SOURCE SCRIPT
업데이트됨 Statistics Table

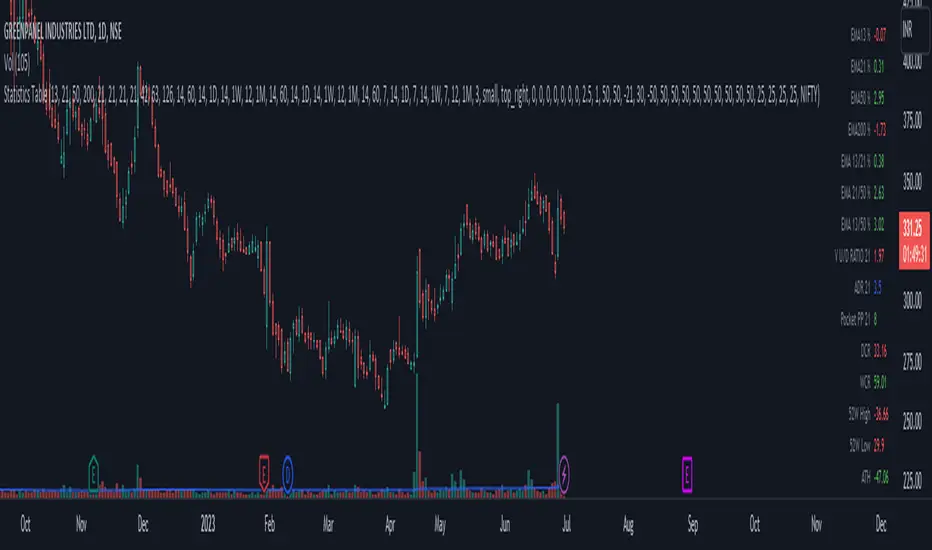
This script display some useful Statistics data that can be useful in making trading decision.
Here the list of information this script is display in table format.
You can change each and every single ema and rs length as per your need from setting.
1) close difference from first ema
2) close difference from second ema
3) close difference from third ema
4) close difference from fourth ema
5) difference between first and second ema
6) difference between second and third ema
7) difference between first and third ema
8) volume up down ratio
9) ATR/ADR %
10) volume pocket pivot count
11) daily closing range
12) weekly closing range
13) close difference from 52week high
14) close difference from 52week low
15) close difference from All time high
16) close difference from All time low
17) rs line above or below first rs ema
18) rs line above or below second rs ema
19) rs line above or below third rs ema
20) rs line above or below fourth rs ema
21) first rs value
22) second rs value
23) third rs value
24) fourth rs value
25) difference between previous first rs length days change % and current first rs length days change %
26) difference between previous second rs length days change % and current second rs length days change %
27) difference between previous third rs length days change % and current third rs length days change %
릴리즈 노트
Added option to hide show each single option릴리즈 노트
Added options to changecolor of regular value
color of positive value
color of negative value
color of label text
change the font size of whole table
릴리즈 노트
bug fix in negative value color option.릴리즈 노트
Added option to setup positive checking condition value as per your need.All the value is checking with greater than equal to.
-> Positive First EMA Diff
-> Positive Second EMA Diff
-> Positive Third EMA Diff
-> Positive Fourth EMA Diff
-> Positive First - Second EMA Diff
-> Positive Second - Third EMA Diff
-> Positive First - Third EMA Diff
-> Positive V U/D RATIO
-> Positive Pocket Pivot Point
-> Positive Daily Closing Range
-> Positive Weekly Closing Range
-> Positive From 52 Week High
-> Positive From 52 Week Low
-> Positive From All Time High
-> Positive From All Time Low
릴리즈 노트
Added option to change the table position릴리즈 노트
Corrected negative value color label text릴리즈 노트
Added 4 RSI with its own timeframe.릴리즈 노트
Added 4 CCI with each different timeframeBug fix in RSI code.
릴리즈 노트
Bug fix in 52 Week high/low code.릴리즈 노트
Added Directional movement index ADX and some improvements
릴리즈 노트
Bug fix in code.오픈 소스 스크립트
트레이딩뷰의 진정한 정신에 따라, 이 스크립트의 작성자는 이를 오픈소스로 공개하여 트레이더들이 기능을 검토하고 검증할 수 있도록 했습니다. 작성자에게 찬사를 보냅니다! 이 코드는 무료로 사용할 수 있지만, 코드를 재게시하는 경우 하우스 룰이 적용된다는 점을 기억하세요.
면책사항
해당 정보와 게시물은 금융, 투자, 트레이딩 또는 기타 유형의 조언이나 권장 사항으로 간주되지 않으며, 트레이딩뷰에서 제공하거나 보증하는 것이 아닙니다. 자세한 내용은 이용 약관을 참조하세요.
오픈 소스 스크립트
트레이딩뷰의 진정한 정신에 따라, 이 스크립트의 작성자는 이를 오픈소스로 공개하여 트레이더들이 기능을 검토하고 검증할 수 있도록 했습니다. 작성자에게 찬사를 보냅니다! 이 코드는 무료로 사용할 수 있지만, 코드를 재게시하는 경우 하우스 룰이 적용된다는 점을 기억하세요.
면책사항
해당 정보와 게시물은 금융, 투자, 트레이딩 또는 기타 유형의 조언이나 권장 사항으로 간주되지 않으며, 트레이딩뷰에서 제공하거나 보증하는 것이 아닙니다. 자세한 내용은 이용 약관을 참조하세요.