PROTECTED SOURCE SCRIPT
Trend Dashboard
Trend Dashboard Indicator
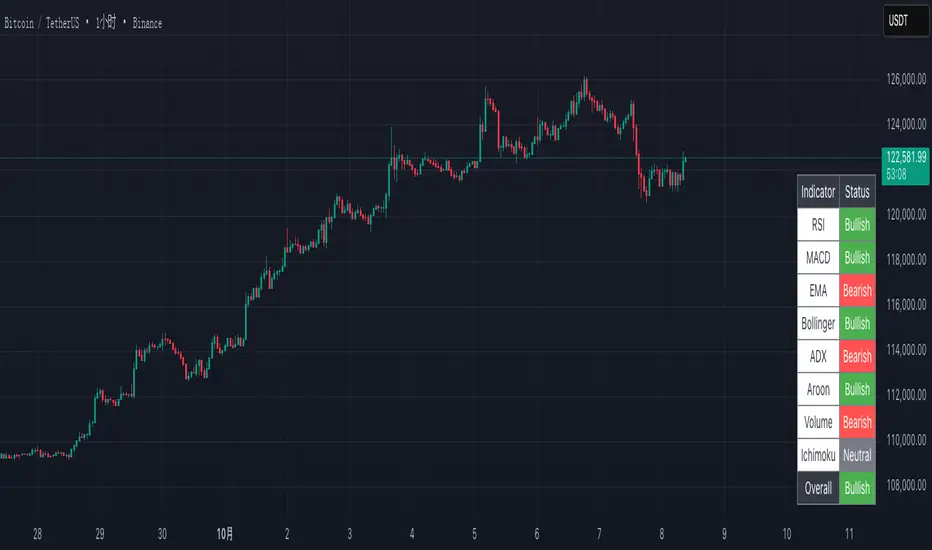
The Trend Dashboard is a custom TradingView Pine Script v5 indicator designed to provide a comprehensive analysis of Bitcoin (BTCUSD) market trends across multiple timeframes. It evaluates eight popular technical indicators—RSI, MACD, EMA, Bollinger Bands, ADX, Aroon, Volume, and Ichimoku Cloud—and displays their bullish, bearish, or neutral status in a clear, color-coded table in the bottom-right corner of the chart. Additionally, it calculates an overall trend assessment based on the collective signals of these indicators, making it a valuable tool for traders seeking a quick, at-a-glance view of market conditions.
The Trend Dashboard is a custom TradingView Pine Script v5 indicator designed to provide a comprehensive analysis of Bitcoin (BTCUSD) market trends across multiple timeframes. It evaluates eight popular technical indicators—RSI, MACD, EMA, Bollinger Bands, ADX, Aroon, Volume, and Ichimoku Cloud—and displays their bullish, bearish, or neutral status in a clear, color-coded table in the bottom-right corner of the chart. Additionally, it calculates an overall trend assessment based on the collective signals of these indicators, making it a valuable tool for traders seeking a quick, at-a-glance view of market conditions.
보호된 스크립트입니다
이 스크립트는 비공개 소스로 게시됩니다. 하지만 제한 없이 자유롭게 사용할 수 있습니다 — 여기에서 자세히 알아보기.
면책사항
이 정보와 게시물은 TradingView에서 제공하거나 보증하는 금융, 투자, 거래 또는 기타 유형의 조언이나 권고 사항을 의미하거나 구성하지 않습니다. 자세한 내용은 이용 약관을 참고하세요.
면책사항
이 정보와 게시물은 TradingView에서 제공하거나 보증하는 금융, 투자, 거래 또는 기타 유형의 조언이나 권고 사항을 의미하거나 구성하지 않습니다. 자세한 내용은 이용 약관을 참고하세요.