OPEN-SOURCE SCRIPT
업데이트됨 True Range Osc
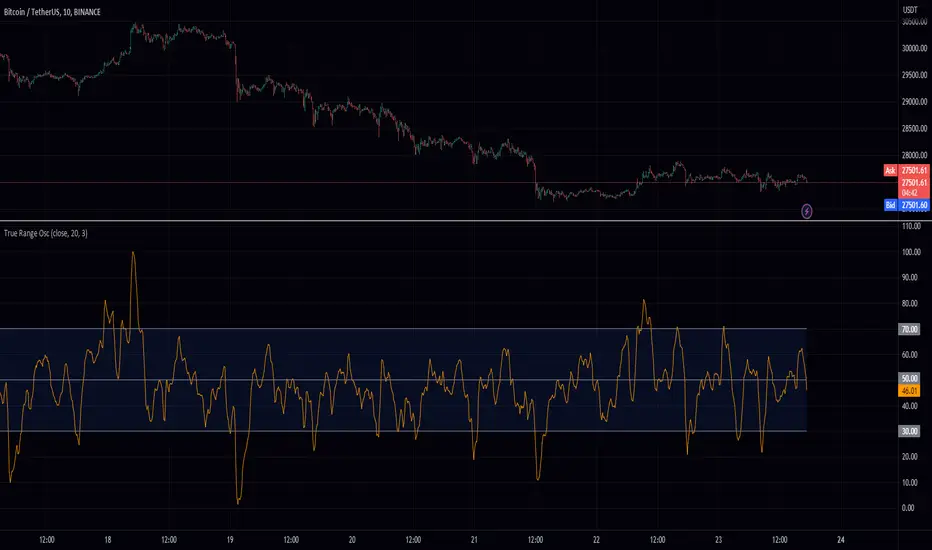
Hey fellow traders! I've just published a new indicator called the True Range Oscillator. It's designed to help you better understand price movements and volatility. The indicator calculates the average true range of the price data and uses a modified z-score-like approach to normalize it. The main difference is that it uses true range instead of standard deviation for normalization.
This oscillator identifies the highest and lowest values within a specified range, excluding any outliers based on standard deviations. It then scales the output between 0 and 100, so you can easily see how the current price action compares to its historical range. You can use the True Range Oscillator to spot potential trend reversals and overbought/oversold conditions.
Here are some features to explore:
Customize your price data source (open, high, low, or close).
Adjust the length and smoothing settings for the average true range calculation.
Find outliers with standard deviations, and tweak the outlier_level and dev_lookback options.
Visualize price action with plotted lines for the upper range (70), lower range (30), and center line (50), along with a shaded area between the upper and lower ranges for added clarity.
I hope you find this indicator useful in your trading journey!
릴리즈 노트
Fixed smoothing오픈 소스 스크립트
트레이딩뷰의 진정한 정신에 따라, 이 스크립트의 작성자는 이를 오픈소스로 공개하여 트레이더들이 기능을 검토하고 검증할 수 있도록 했습니다. 작성자에게 찬사를 보냅니다! 이 코드는 무료로 사용할 수 있지만, 코드를 재게시하는 경우 하우스 룰이 적용된다는 점을 기억하세요.
면책사항
해당 정보와 게시물은 금융, 투자, 트레이딩 또는 기타 유형의 조언이나 권장 사항으로 간주되지 않으며, 트레이딩뷰에서 제공하거나 보증하는 것이 아닙니다. 자세한 내용은 이용 약관을 참조하세요.
오픈 소스 스크립트
트레이딩뷰의 진정한 정신에 따라, 이 스크립트의 작성자는 이를 오픈소스로 공개하여 트레이더들이 기능을 검토하고 검증할 수 있도록 했습니다. 작성자에게 찬사를 보냅니다! 이 코드는 무료로 사용할 수 있지만, 코드를 재게시하는 경우 하우스 룰이 적용된다는 점을 기억하세요.
면책사항
해당 정보와 게시물은 금융, 투자, 트레이딩 또는 기타 유형의 조언이나 권장 사항으로 간주되지 않으며, 트레이딩뷰에서 제공하거나 보증하는 것이 아닙니다. 자세한 내용은 이용 약관을 참조하세요.