OPEN-SOURCE SCRIPT
업데이트됨 Normal Distribution Asymmetry & Volatility Zones
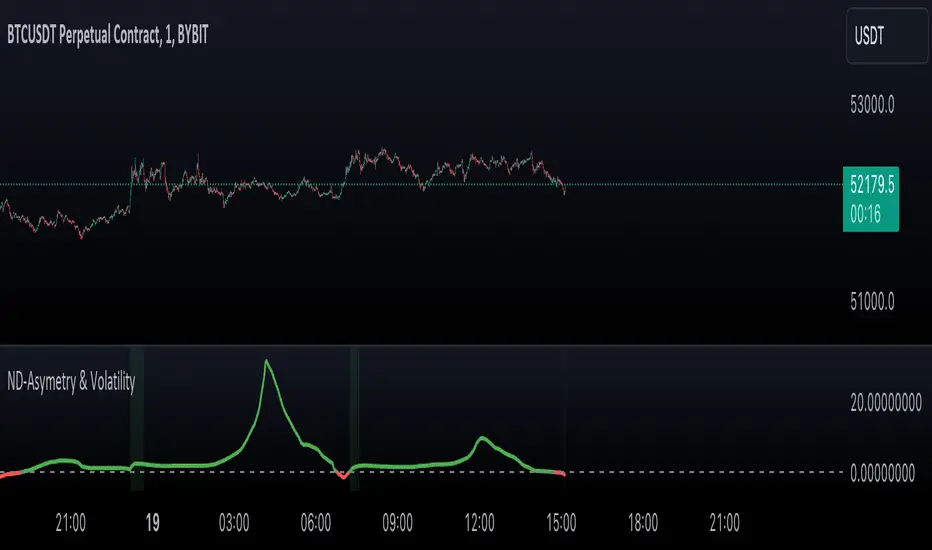
Normal Distribution Asymmetry & Volatility Zones Indicator provides insights into the skewness of a price distribution and identifies potential volatility zones in the market. The indicator calculates the skewness coefficient, indicating the asymmetry of the price distribution, and combines it with a measure of volatility to define buy and sell zones.
By combining skewness analysis and volatility thresholds, this indicator offers traders a unique perspective on potential market movements, helping them make informed trading decisions. Please note that trading involves risks, and this indicator should be used in conjunction with other analysis and risk management techniques.
- The key features of this indicator include:
- Skewness Calculation: It calculates the skewness coefficient, a statistical measure that reveals whether the price distribution is skewed to the left (negative skewness) or right (positive skewness).
- Volatility Zones: Based on the skewness and a user-defined volatility threshold, the indicator identifies buy and sell zones where potential price movements may occur. Buy zones are marked when skewness is negative and prices are below a volatility threshold. Sell zones are marked when skewness is positive and prices are above the threshold.
- Signal Source Selection: Traders can select the source of price data for analysis, allowing flexibility in their trading strategy.
- Customizable Parameters: Users can adjust the length of the distribution, the volatility threshold, and other parameters to tailor the indicator to their specific trading preferences and market conditions.
- Visual Signals: Buy and sell zones are visually displayed on the chart, making it easy to identify potential trade opportunities.
- Background Color: The indicator changes the background color of the chart to highlight significant zones, providing a clear visual cue for traders.
By combining skewness analysis and volatility thresholds, this indicator offers traders a unique perspective on potential market movements, helping them make informed trading decisions. Please note that trading involves risks, and this indicator should be used in conjunction with other analysis and risk management techniques.
릴리즈 노트
Modified the maximum value for the length to 500릴리즈 노트
Adjusted the maximum value of "Distribution Length" and implemented some minor code modifications.릴리즈 노트
Updated the color scheme to enhance the indicator's intuitiveness.릴리즈 노트
- Code refactor
- Added tooltips for input variables
릴리즈 노트
- Added an option to switch between raw and normalized skewness values through the 'Plot normalized' setting, offering users more flexibility in market analysis.
- Enhanced the skewness calculation by incorporating the normalization process, which compares the current skewness value to a moving average of recent skewness values.
- Introduced normalization length parameter allowing users to define the period for normalization, optimizing signal accuracy based on individual trading strategies.
- Incorporated an indicator description as comments within the code to provide better context and understanding
릴리즈 노트
- Moved "Normal Distribution Asymmetry & Volatility Zones Indicator" calculations to the "NormalDistributionFunctions" library for easier integration.
- Enabled easy integration of the "skewness" function for user scripts, enhancing custom analysis.
오픈 소스 스크립트
트레이딩뷰의 진정한 정신에 따라, 이 스크립트의 작성자는 이를 오픈소스로 공개하여 트레이더들이 기능을 검토하고 검증할 수 있도록 했습니다. 작성자에게 찬사를 보냅니다! 이 코드는 무료로 사용할 수 있지만, 코드를 재게시하는 경우 하우스 룰이 적용된다는 점을 기억하세요.
면책사항
해당 정보와 게시물은 금융, 투자, 트레이딩 또는 기타 유형의 조언이나 권장 사항으로 간주되지 않으며, 트레이딩뷰에서 제공하거나 보증하는 것이 아닙니다. 자세한 내용은 이용 약관을 참조하세요.
오픈 소스 스크립트
트레이딩뷰의 진정한 정신에 따라, 이 스크립트의 작성자는 이를 오픈소스로 공개하여 트레이더들이 기능을 검토하고 검증할 수 있도록 했습니다. 작성자에게 찬사를 보냅니다! 이 코드는 무료로 사용할 수 있지만, 코드를 재게시하는 경우 하우스 룰이 적용된다는 점을 기억하세요.
면책사항
해당 정보와 게시물은 금융, 투자, 트레이딩 또는 기타 유형의 조언이나 권장 사항으로 간주되지 않으며, 트레이딩뷰에서 제공하거나 보증하는 것이 아닙니다. 자세한 내용은 이용 약관을 참조하세요.