OPEN-SOURCE SCRIPT
업데이트됨 Cumulative Volume Delta (MTF)
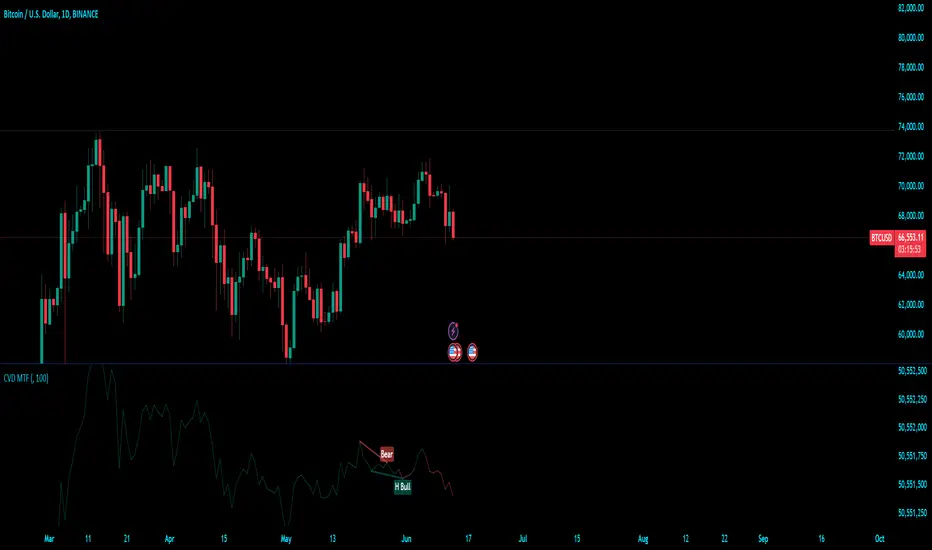
Cumulative Volume Delta (CVD) Indicator
The Cumulative Volume Delta (CVD) indicator is a powerful analytical tool used to understand the behavior and dynamics of market participants through volume analysis. It tracks the net difference between buying and selling pressure, providing insights into market trends and potential reversals. Here's a detailed description of this indicator and its components:
The Cumulative Volume Delta (CVD) indicator calculates the cumulative net difference between buying and selling volume over a specified period. By analyzing this net difference, traders can gain insights into the underlying strength or weakness of a price movement, helping to identify trends, reversals, and potential breakout points.
Key Components:
Multi-Timeframe Functionality:
The enhanced version of the CVD indicator includes multi-timeframe (MTF) capabilities, allowing users to select and analyze data from different timeframes. This feature enhances the versatility of the indicator by providing a broader perspective on market dynamics across various time intervals.
Practical Applications:
The Cumulative Volume Delta (CVD) indicator is a powerful analytical tool used to understand the behavior and dynamics of market participants through volume analysis. It tracks the net difference between buying and selling pressure, providing insights into market trends and potential reversals. Here's a detailed description of this indicator and its components:
The Cumulative Volume Delta (CVD) indicator calculates the cumulative net difference between buying and selling volume over a specified period. By analyzing this net difference, traders can gain insights into the underlying strength or weakness of a price movement, helping to identify trends, reversals, and potential breakout points.
Key Components:
- Bull & Bear Power Calculation:
- Bull Power: Represents the strength of buyers in the market. It is calculated based on the relationship between the current and previous price bars. A higher Bull Power indicates stronger buying pressure.
Bear Power: Represents the strength of sellers in the market. It is also calculated based on the relationship between the current and previous price bars. A higher Bear Power indicates stronger selling pressure. - Bull & Bear Volume Calculation:
- Bull Volume: The volume attributed to buying pressure. It is calculated by taking the proportion of Bull Power relative to the total of Bull Power and Bear Power, multiplied by the total volume.
Bear Volume: The volume attributed to selling pressure. It is calculated similarly to Bull Volume but using Bear Power. - Delta Calculation:
- Delta: The net difference between Bull Volume and Bear Volume for each bar. A positive Delta indicates more buying pressure, while a negative Delta indicates more selling pressure.
- Cumulative Volume Delta (CVD):
- CVD: The running total of the Delta values over time. It accumulates the net buying and selling pressure to provide a visual representation of the market's cumulative sentiment.
- Moving Average of CVD (CVD MA):
- CVD MA: A simple moving average of the CVD, used to smooth out fluctuations and help identify the overall trend. It provides a baseline to compare the current CVD value against, highlighting divergences or convergences.
- CVD MA: A simple moving average of the CVD, used to smooth out fluctuations and help identify the overall trend. It provides a baseline to compare the current CVD value against, highlighting divergences or convergences.
Multi-Timeframe Functionality:
The enhanced version of the CVD indicator includes multi-timeframe (MTF) capabilities, allowing users to select and analyze data from different timeframes. This feature enhances the versatility of the indicator by providing a broader perspective on market dynamics across various time intervals.
Practical Applications:
- Trend Identification: By tracking the CVD and its moving average, traders can identify the prevailing trend. An upward-sloping CVD indicates sustained buying pressure, while a downward-sloping CVD indicates sustained selling pressure.
- Divergences: Divergences between the CVD and price can signal potential reversals. For example, if the price is making new highs but the CVD is not, it may indicate weakening buying pressure and a potential reversal.
- Breakout Confirmation: Significant changes in the CVD can confirm breakouts. A sharp increase in the CVD during a price breakout indicates strong buying support, adding confidence to the breakout.
- Support and Resistance Levels: The CVD can help identify significant support and resistance levels based on changes in volume dynamics. For instance, a notable increase in buying volume at a support level can reinforce its strength.
릴리즈 노트
bearish/bullish coloring릴리즈 노트
plot ema and fill based on options릴리즈 노트
un used code릴리즈 노트
code enhancement릴리즈 노트
- default color/ custom coloring
- auto detection of divergences
- auto plot divergence lines using custom coloring
릴리즈 노트
use current time frame option fixed오픈 소스 스크립트
트레이딩뷰의 진정한 정신에 따라, 이 스크립트의 작성자는 이를 오픈소스로 공개하여 트레이더들이 기능을 검토하고 검증할 수 있도록 했습니다. 작성자에게 찬사를 보냅니다! 이 코드는 무료로 사용할 수 있지만, 코드를 재게시하는 경우 하우스 룰이 적용된다는 점을 기억하세요.
면책사항
해당 정보와 게시물은 금융, 투자, 트레이딩 또는 기타 유형의 조언이나 권장 사항으로 간주되지 않으며, 트레이딩뷰에서 제공하거나 보증하는 것이 아닙니다. 자세한 내용은 이용 약관을 참조하세요.
오픈 소스 스크립트
트레이딩뷰의 진정한 정신에 따라, 이 스크립트의 작성자는 이를 오픈소스로 공개하여 트레이더들이 기능을 검토하고 검증할 수 있도록 했습니다. 작성자에게 찬사를 보냅니다! 이 코드는 무료로 사용할 수 있지만, 코드를 재게시하는 경우 하우스 룰이 적용된다는 점을 기억하세요.
면책사항
해당 정보와 게시물은 금융, 투자, 트레이딩 또는 기타 유형의 조언이나 권장 사항으로 간주되지 않으며, 트레이딩뷰에서 제공하거나 보증하는 것이 아닙니다. 자세한 내용은 이용 약관을 참조하세요.