OPEN-SOURCE SCRIPT
업데이트됨 Best Support And Resistance Indicator V1 [ForexBee]
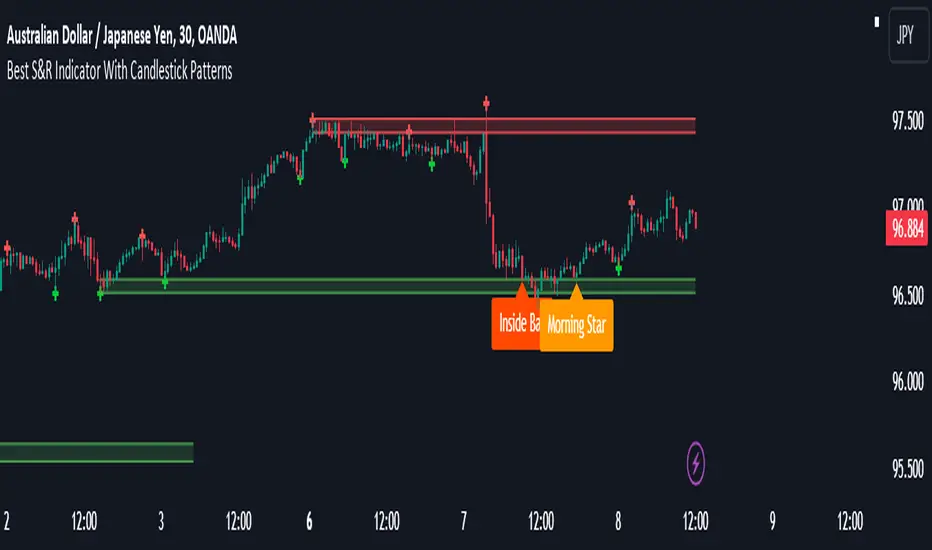
This Indicator Identifies and draws the support and resistance Zones On the Chart
🔶Overview
The support and resistance indicator is a technical indicator that will plot the support zone and resistance zone on the candlestick chart. It determines the price touches to find the strong support resistance zones.
The support and resistance indicator is the most basic technical analysis in trading. Instead of drawing zones manually, this indicator can save you time by plotting zones automatically.

🔶Working
There are specific characteristics of a valid support and resistance zone. Price always bounces upward from the support zone while it bounces downward from the resistance zone. On the other hand, when a breakout of the support or resistance zone happens, the price trends toward the breakout.
🔶Valid support zone
When the price touches a zone two to three times and bounces in a bullish direction, it is a good support zone.
The main point is that you should always find the bounces in clear price swings. The touches or bounces of the price must not be in the form of a choppy market. Price always moves in the form of swings or waves.

🔶Valid resistance zone
When the price touches a zone two to three times with a bounce in a bearish direction, then a valid resistance zone forms.
Here the price bounces must be in the form of swings or waves. You must avoid a choppy market.
So the support and resistance zone indicator finds these parameters on the chart and draws only valid zones.

🔶Settings of indicator

There are two inputs available in the indicator.
Number of bars for swing
The number of bars for the swing bars represents the size of the swing for a valid support or resistance touch. This parameter helps to filter the ranging price. the default value is 10.
Number of Tests for valid support and resistance
In this indicator, the number of pivots represents the support or resistance touches. so if you select the number 3, the indicator will only draw a zone with three touches.
🔶Features
There are the following features that this indicator identifies automatically, so you don’t need to do manual work.
We are also adding the feature of a candlestick pattern at the zone, which will be added in the next update.
🔶Overview
The support and resistance indicator is a technical indicator that will plot the support zone and resistance zone on the candlestick chart. It determines the price touches to find the strong support resistance zones.
The support and resistance indicator is the most basic technical analysis in trading. Instead of drawing zones manually, this indicator can save you time by plotting zones automatically.
🔶Working
There are specific characteristics of a valid support and resistance zone. Price always bounces upward from the support zone while it bounces downward from the resistance zone. On the other hand, when a breakout of the support or resistance zone happens, the price trends toward the breakout.
🔶Valid support zone
When the price touches a zone two to three times and bounces in a bullish direction, it is a good support zone.
The main point is that you should always find the bounces in clear price swings. The touches or bounces of the price must not be in the form of a choppy market. Price always moves in the form of swings or waves.
🔶Valid resistance zone
When the price touches a zone two to three times with a bounce in a bearish direction, then a valid resistance zone forms.
Here the price bounces must be in the form of swings or waves. You must avoid a choppy market.
So the support and resistance zone indicator finds these parameters on the chart and draws only valid zones.
🔶Settings of indicator
There are two inputs available in the indicator.
Number of bars for swing
The number of bars for the swing bars represents the size of the swing for a valid support or resistance touch. This parameter helps to filter the ranging price. the default value is 10.
Number of Tests for valid support and resistance
In this indicator, the number of pivots represents the support or resistance touches. so if you select the number 3, the indicator will only draw a zone with three touches.
🔶Features
There are the following features that this indicator identifies automatically, so you don’t need to do manual work.
- Identify the valid support and resistance zones
- Add the confluence of swings or waves during zone identification
- Choppy market filter
We are also adding the feature of a candlestick pattern at the zone, which will be added in the next update.
릴리즈 노트
Added Alerts For The Detection Of Support And Resistance Zones릴리즈 노트
Now The indicator Also Shows Candlestick Patterns at support and resistance levels.릴리즈 노트
Updated The Confluences오픈 소스 스크립트
트레이딩뷰의 진정한 정신에 따라, 이 스크립트의 작성자는 이를 오픈소스로 공개하여 트레이더들이 기능을 검토하고 검증할 수 있도록 했습니다. 작성자에게 찬사를 보냅니다! 이 코드는 무료로 사용할 수 있지만, 코드를 재게시하는 경우 하우스 룰이 적용된다는 점을 기억하세요.
ForexBee
면책사항
해당 정보와 게시물은 금융, 투자, 트레이딩 또는 기타 유형의 조언이나 권장 사항으로 간주되지 않으며, 트레이딩뷰에서 제공하거나 보증하는 것이 아닙니다. 자세한 내용은 이용 약관을 참조하세요.
오픈 소스 스크립트
트레이딩뷰의 진정한 정신에 따라, 이 스크립트의 작성자는 이를 오픈소스로 공개하여 트레이더들이 기능을 검토하고 검증할 수 있도록 했습니다. 작성자에게 찬사를 보냅니다! 이 코드는 무료로 사용할 수 있지만, 코드를 재게시하는 경우 하우스 룰이 적용된다는 점을 기억하세요.
ForexBee
면책사항
해당 정보와 게시물은 금융, 투자, 트레이딩 또는 기타 유형의 조언이나 권장 사항으로 간주되지 않으며, 트레이딩뷰에서 제공하거나 보증하는 것이 아닙니다. 자세한 내용은 이용 약관을 참조하세요.