OPEN-SOURCE SCRIPT
업데이트됨 ReadyFor401ks Pivot / Support / Resist
Overview
The ReadyFor401ks Pivot / Support / Resist indicator is a versatile tool designed to help traders identify key price levels—pivots, supports, and resistances—derived from a higher timeframe. This indicator recalculates levels based on a user-defined timeframe, providing you with a broader context for potential market reversals and continuations.
Key Features and Benefits
• Customizable Higher Timeframe:
You can select the frequency at which the levels are recalculated. For example, on a Daily chart, you might choose a 3-month timeframe to determine the pivot levels. This allows you to capture longer-term support and resistance zones that can be crucial for identifying major price reactions.
• Visual Clarity:
With toggles to show or hide the pivot, support, and resistance lines on the price chart, you have full control over the visual clutter on your chart. Additionally, you can choose to display the exact price values directly on the price scale, giving you an immediate reference as you trade.
• Enhanced Data Display:
In addition to price scale labels, the indicator offers an option to show the level values on the status line (data window). This feature is especially beneficial for traders who want to keep a close eye on these key levels without compromising chart space.
Practical Example
Imagine you’re analyzing a Daily chart while the indicator is set to recalculate levels on a 3-month frequency. Over a three-month period, the indicator determines a pivot point (P) along with three levels of resistance (R1, R2, R3) and support (S1, S2, S3). As price action unfolds, you may observe that:
• Price approaches the pivot level (P): This could indicate a potential reversal or a consolidation zone.
• Price bounces off a resistance level (e.g., R1): Signaling that the market is struggling to break higher.
• Price finds support at S1: Providing an opportunity to look for a bullish reversal.
By combining these insights with your own technical analysis, you can make more informed trading decisions based on significant levels that have been validated over a longer timeframe.
Conclusion
The ReadyFor401ks Pivot / Support / Resist indicator is ideal for traders who want to add an extra layer of confirmation to their trading strategies by identifying key price levels derived from higher timeframe data. Whether you’re a swing trader or a long-term investor, this tool helps you visualize crucial support and resistance areas, improving your market timing and risk management. Enjoy the enhanced clarity and flexibility this indicator offers on your TradingView charts!
릴리즈 노트
This indicator provides Pivot Points, Support, and Resistance Levels based on the selected timeframe, helping traders identify key price levels where reversals or breakouts may occur. The script dynamically calculates levels based on the previous period’s high, low, and close, allowing traders to adapt it for daily, weekly, or even monthly analysis.📌 Features & Functionality
🔹 Dynamic Pivot Point Calculation – Uses standard pivot formulas based on the selected higher timeframe (daily, weekly, etc.).
🔹 Support & Resistance Levels – Displays R1, R2, R3 (Resistance Levels) and S1, S2, S3 (Support Levels) for enhanced decision-making.
🔹 Customizable Display Options –
✔️ Toggle on/off pivot levels on the chart
✔️ Show/hide price values directly on the price scale
✔️ Show/hide key levels on the status line (next to the ticker in TradingView)
🔹 Optimized Chart Display – Ensures a clean visualization while keeping relevant data visible.
🔹 Multi-Timeframe Support – Allows traders to adjust recalculation frequency using a higher timeframe input (e.g., Daily, Weekly, Monthly).
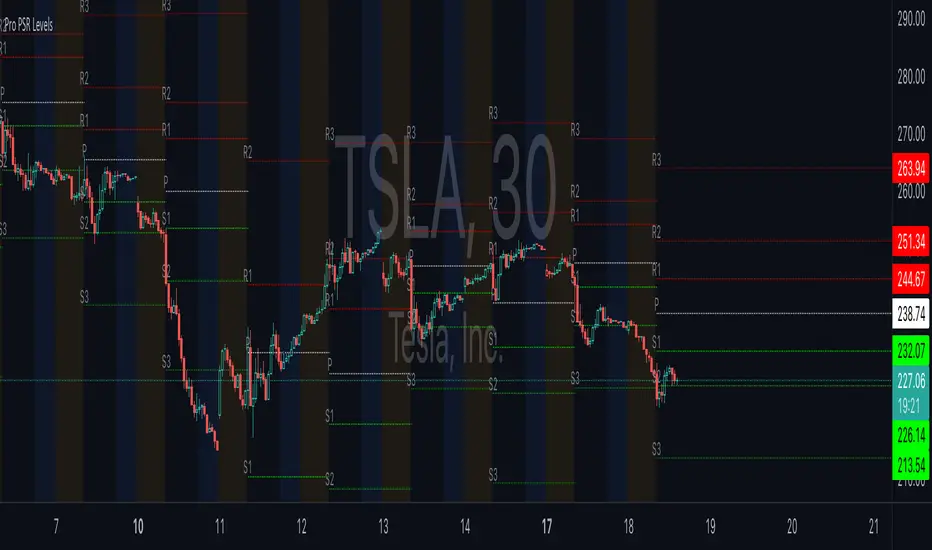
Example of Indicator on TSLA 1min Chart
Example of TSLA Daily Chart with Levels calculated on a 3 Month (Quarterly) Frequency
📌 How to Use
1️⃣ Select the timeframe for recalculating pivots in the settings (e.g., Daily, Weekly).
2️⃣ Enable/disable visibility of pivot levels, price scale values, and status line information.
3️⃣ Use the pivot, support, and resistance levels to identify potential bounce zones, breakouts, or trend reversals.
4️⃣ The script works across all asset classes including stocks, forex, and crypto.
This script is ideal for traders looking to integrate pivot-based price action analysis into their strategy while maintaining a clutter-free chart.
오픈 소스 스크립트
트레이딩뷰의 진정한 정신에 따라, 이 스크립트의 작성자는 이를 오픈소스로 공개하여 트레이더들이 기능을 검토하고 검증할 수 있도록 했습니다. 작성자에게 찬사를 보냅니다! 이 코드는 무료로 사용할 수 있지만, 코드를 재게시하는 경우 하우스 룰이 적용된다는 점을 기억하세요.
As always, please let me know if you see something I didn't catch.
면책사항
해당 정보와 게시물은 금융, 투자, 트레이딩 또는 기타 유형의 조언이나 권장 사항으로 간주되지 않으며, 트레이딩뷰에서 제공하거나 보증하는 것이 아닙니다. 자세한 내용은 이용 약관을 참조하세요.