OPEN-SOURCE SCRIPT
Trend Analyzer v0.6
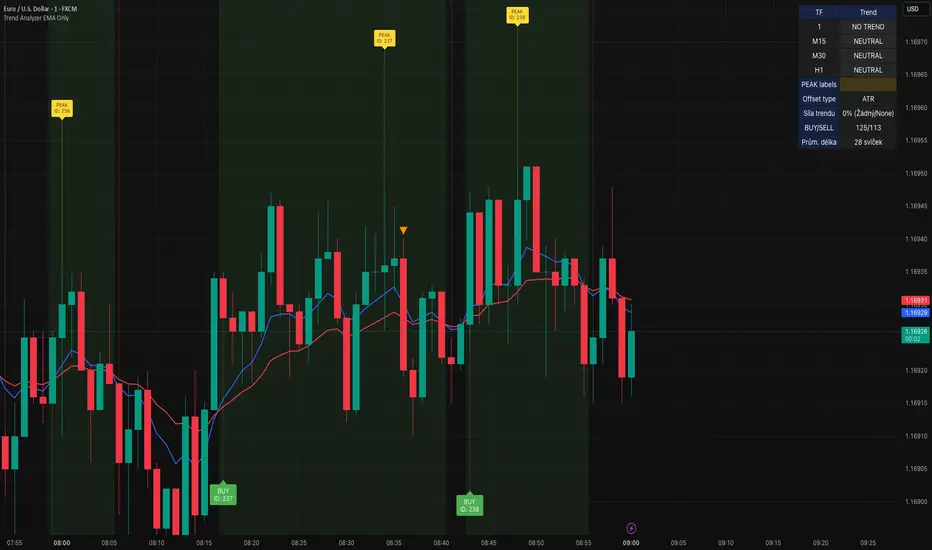
Trend Analyzer EMA Only v0.6
Simple yet powerful EMA trend analysis with multi-timeframe support!
Overview:
This comprehensive indicator focuses on EMA-based trend analysis with clean visual presentation. It provides clear BUY/SELL signals, trend tracking with unique IDs, peak detection, and multi-timeframe analysis across M15, M30, and H1 timeframes.
Key Features:
✅ EMA Trend Analysis - Fast and Slow EMA crossover signals
✅ Trend Tracking - Unique trend IDs with start/end markers
✅ Peak Detection - Automatic peak identification during trends
✅ Multi-Timeframe - Analysis across M15, M30, and H1 timeframes
✅ Visual Clarity - Dotted lines connecting labels to candles
✅ Statistics - BUY/SELL count and average trend length
How It Works:
The indicator calculates signal strength using weighted analysis:
• MACD (50%) - Primary trend momentum
• RSI (30%) - Overbought/oversold conditions
• Volume (20%) - Volume confirmation
Signal Logic:
• BUY - Fast EMA crosses above Slow EMA + both slopes positive
• SELL - Fast EMA crosses below Slow EMA + both slopes negative
• NEUTRAL - EMAs too close (below threshold)
Visual Elements:
• 🟢 BUY - Green label with trend ID
• 🔴 SELL - Red label with trend ID
• ⚪ NEUTRAL - Gray label with trend ID
• 🟡 PEAK - Yellow label marking trend extremes
• ⚫ END - Gray label marking trend end
Information Table:
Real-time display showing:
• Current Timeframe trend state
• Multi-Timeframe analysis (M15, M30, H1)
• PEAK Labels status
• Offset Type configuration
• Trend Strength percentage
• Statistics (BUY/SELL count, average trend length)
Settings:
• Fast EMA Length - 9 (default)
• Slow EMA Length - 21 (default)
• Min Trend Bars - 3 (filters short trends)
• Label Offset Type - ATR, % of price, or Dynamic
• Show PEAK Labels - On/Off toggle
Best Practices:
🎯 Works best in trending markets
📊 Use as overlay on main chart
⚡ Combine with price action analysis
🛡️ Always use proper risk management
Pro Tips:
• Green background = Strong uptrend, Red background = Strong downtrend
• Watch for trend change arrows for early reversal signals
• Use the information table for quick market assessment
• Monitor trend statistics for market behavior insights
Alerts:
• BUY Alert - "BUY signal detected"
• SELL Alert - "SELL signal detected"
Version 0.6 Improvements:
• Optimized performance
• Enhanced visual clarity
• Improved multi-timeframe analysis
• Refined trend detection algorithms
Created with ❤️ for the trading community
This indicator is free to use for both commercial and non-commercial purposes.
오픈 소스 스크립트
트레이딩뷰의 진정한 정신에 따라, 이 스크립트의 작성자는 이를 오픈소스로 공개하여 트레이더들이 기능을 검토하고 검증할 수 있도록 했습니다. 작성자에게 찬사를 보냅니다! 이 코드는 무료로 사용할 수 있지만, 코드를 재게시하는 경우 하우스 룰이 적용된다는 점을 기억하세요.
면책사항
해당 정보와 게시물은 금융, 투자, 트레이딩 또는 기타 유형의 조언이나 권장 사항으로 간주되지 않으며, 트레이딩뷰에서 제공하거나 보증하는 것이 아닙니다. 자세한 내용은 이용 약관을 참조하세요.
오픈 소스 스크립트
트레이딩뷰의 진정한 정신에 따라, 이 스크립트의 작성자는 이를 오픈소스로 공개하여 트레이더들이 기능을 검토하고 검증할 수 있도록 했습니다. 작성자에게 찬사를 보냅니다! 이 코드는 무료로 사용할 수 있지만, 코드를 재게시하는 경우 하우스 룰이 적용된다는 점을 기억하세요.
면책사항
해당 정보와 게시물은 금융, 투자, 트레이딩 또는 기타 유형의 조언이나 권장 사항으로 간주되지 않으며, 트레이딩뷰에서 제공하거나 보증하는 것이 아닙니다. 자세한 내용은 이용 약관을 참조하세요.