OPEN-SOURCE SCRIPT
업데이트됨 MCG - Meme Coin Gains [Logue]
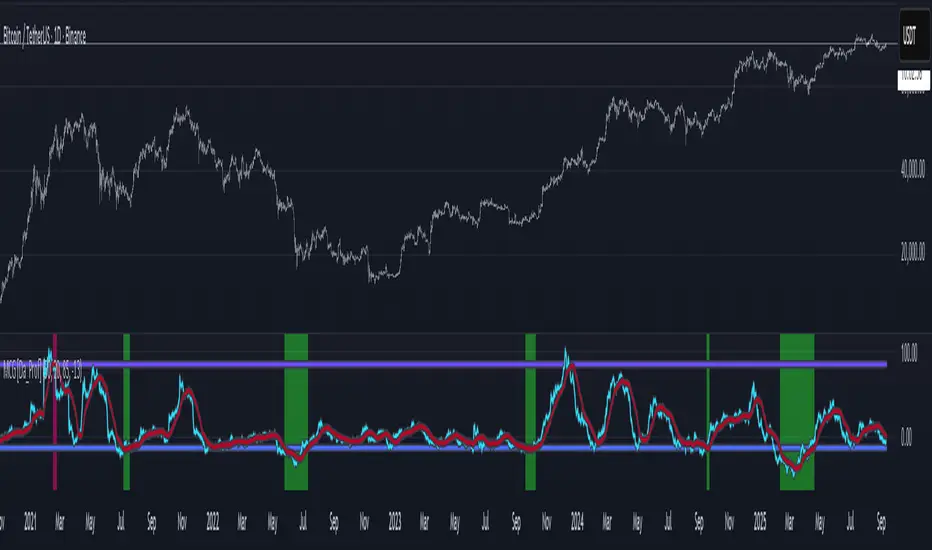
Meme Coin Gains. Investor preference for meme coin trading may signal irrational exuberance in the crypto market. If a large spike in meme coin gains is observed, a top may be near. Therefore, the gains of the most popular meme coins (DOGE, SHIB, SATS, ORDI, BONK, PEPE, and FLOKI) were averaged together in this indicator to help indicate potential mania phases, which may signal nearing of a top. Two simple moving averages of the meme coin gains are used to smooth the data and help visualize changes in trend. In back testing, I found a 10-day "fast" sma and a 20-day "slow" sma of the meme coin gains works well to signal tops and bottoms when extreme values of this indicator are reached.
Meme coins were not traded heavily prior to 2020. Therefore, there is only one cycle to test at the time of initial publication. Also, the meme coin space moves fast, so more meme coins may need to be added later. Also, once a meme coin has finished its mania phase where everyone and their mother has heard of it, it doesn't seem to run again (at least with the data up until time of publication). Therefore, the value of this indicator may not be great unless it is updated frequently.
The two moving averages are plotted. For the indicator, top and bottom "slow" sma trigger lines are plotted. The sma trigger line and the periods (daily) of the moving averages can be modified to your own preferences. The "slow" sma going above or below the trigger lines will print a different background color. Plot on a linear scale if you want to view this as similar to an RSI-type indicator. Plot on a log scale if you want to view as similar to a stochastic RSI.
Use this indicator at your own risk. I make no claims as to its accuracy in forecasting future trend changes of Bitcoin or the crypto market.
릴리즈 노트
Updated to add in the new meme coins in the top 100. I also removed OORDI and 릴리즈 노트
Updated this indicator by adding alerts for the indicator and the simple moving average crossing the top and bottom lines. Honestly, I can't believe I didn't have them added when I first wrote the script. Hopefully, that didn't degrade it's usefulness for you all. Have fun with the script.
--Da_Prof
릴리즈 노트
Thanks TradingView for creating the symbol MEME.C. This indicator will now be automatically updated. I also cleaned up the alerts. The indicator is set to get data from MEME.C on the daily so that it can work when looking at other symbols. As memecoins get higher in marketcap, the top trigger line may need to be adjusted. 릴리즈 노트
Updated the script to add in data for individual meme coins for days that MEME.C does not have data. The indicator can now be used on multiple timeframes, but the indicator inputs are optimized for the daily timeframe. This indicator seems to work better for identifying lower risk times to buy crypto (not just memes). Current settings do not seem to work well to identify tops. Do some back testing and let me know if you find good top settings for the daily. I might separate bottom and top settings if you let me know some good top settings. Note: I plotted the indicator on ETH/USDT just to show how nicely it finds areas where bottoms are formed. Not perfect, but pretty good.
--Da_Prof
릴리즈 노트
Fixed the defaults for the trigger lines and made minor changes to pretty up the display of the indicator. --Da_Prof
오픈 소스 스크립트
트레이딩뷰의 진정한 정신에 따라, 이 스크립트의 작성자는 이를 오픈소스로 공개하여 트레이더들이 기능을 검토하고 검증할 수 있도록 했습니다. 작성자에게 찬사를 보냅니다! 이 코드는 무료로 사용할 수 있지만, 코드를 재게시하는 경우 하우스 룰이 적용된다는 점을 기억하세요.
면책사항
해당 정보와 게시물은 금융, 투자, 트레이딩 또는 기타 유형의 조언이나 권장 사항으로 간주되지 않으며, 트레이딩뷰에서 제공하거나 보증하는 것이 아닙니다. 자세한 내용은 이용 약관을 참조하세요.
오픈 소스 스크립트
트레이딩뷰의 진정한 정신에 따라, 이 스크립트의 작성자는 이를 오픈소스로 공개하여 트레이더들이 기능을 검토하고 검증할 수 있도록 했습니다. 작성자에게 찬사를 보냅니다! 이 코드는 무료로 사용할 수 있지만, 코드를 재게시하는 경우 하우스 룰이 적용된다는 점을 기억하세요.
면책사항
해당 정보와 게시물은 금융, 투자, 트레이딩 또는 기타 유형의 조언이나 권장 사항으로 간주되지 않으며, 트레이딩뷰에서 제공하거나 보증하는 것이 아닙니다. 자세한 내용은 이용 약관을 참조하세요.