OPEN-SOURCE SCRIPT
[QG] Dynamic Zones Value Chart
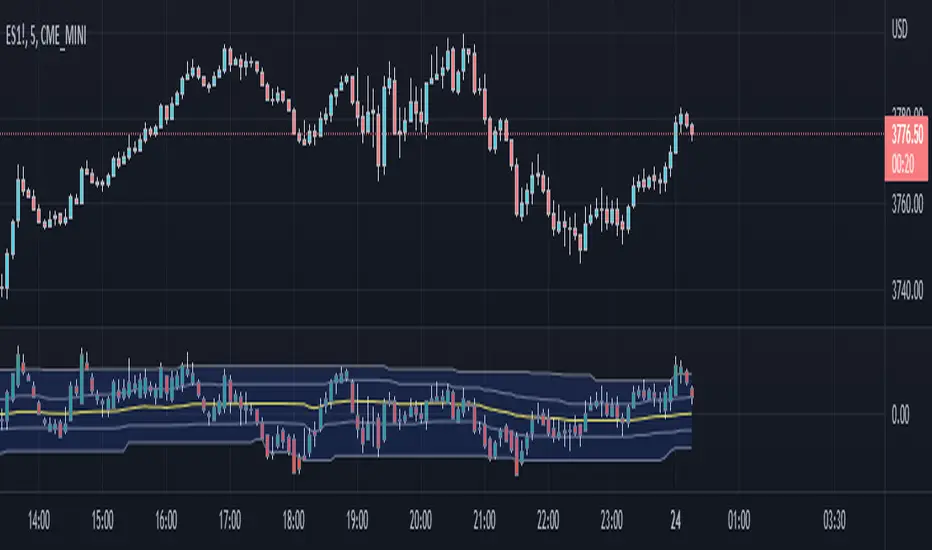
The classic value charts indicator has fixed overbought and oversold levels at 8 and 10 levels and the idea of adding dynamic zones around them instead of fixed levels is appealing.
During the strong trending movements, the overbought and oversold levels also dynamically move up or down.
I have used the dynamic zones code by @allanster.
The idea of using dynamic zones on value charts comes from a similar indicator available in mql4.
During the strong trending movements, the overbought and oversold levels also dynamically move up or down.
I have used the dynamic zones code by @allanster.
The idea of using dynamic zones on value charts comes from a similar indicator available in mql4.
오픈 소스 스크립트
트레이딩뷰의 진정한 정신에 따라, 이 스크립트의 작성자는 이를 오픈소스로 공개하여 트레이더들이 기능을 검토하고 검증할 수 있도록 했습니다. 작성자에게 찬사를 보냅니다! 이 코드는 무료로 사용할 수 있지만, 코드를 재게시하는 경우 하우스 룰이 적용된다는 점을 기억하세요.
면책사항
해당 정보와 게시물은 금융, 투자, 트레이딩 또는 기타 유형의 조언이나 권장 사항으로 간주되지 않으며, 트레이딩뷰에서 제공하거나 보증하는 것이 아닙니다. 자세한 내용은 이용 약관을 참조하세요.
오픈 소스 스크립트
트레이딩뷰의 진정한 정신에 따라, 이 스크립트의 작성자는 이를 오픈소스로 공개하여 트레이더들이 기능을 검토하고 검증할 수 있도록 했습니다. 작성자에게 찬사를 보냅니다! 이 코드는 무료로 사용할 수 있지만, 코드를 재게시하는 경우 하우스 룰이 적용된다는 점을 기억하세요.
면책사항
해당 정보와 게시물은 금융, 투자, 트레이딩 또는 기타 유형의 조언이나 권장 사항으로 간주되지 않으며, 트레이딩뷰에서 제공하거나 보증하는 것이 아닙니다. 자세한 내용은 이용 약관을 참조하세요.