OPEN-SOURCE SCRIPT
PumpC Tick Levels Marker
🧾 Description
PumpC Tick Levels Marker
A precision price-level visualization tool designed for futures and tick-based traders.
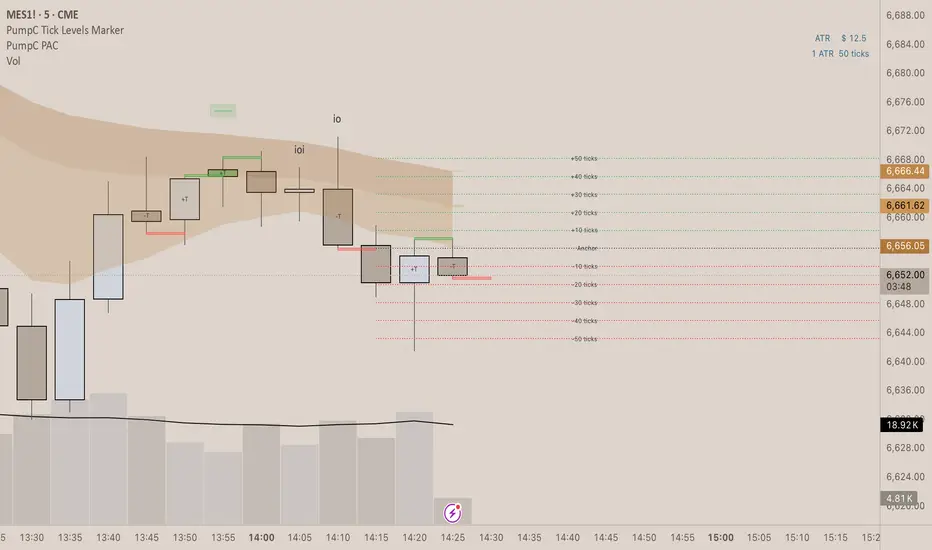
Easily mark a single reference price and automatically plot symmetrical tick levels above and below it.
🔍 How It Works
Select your Anchor Price — this acts as the central reference point.
The script automatically plots upward and downward tick levels spaced by your chosen tick multiple.
Labels display tick distance (+/- ticks) and can be offset to the right by a set number of bars for clean alignment near the price scale.
⚙️ Key Features
One-click anchor control — define a single reference price.
Custom tick spacing — choose your tick multiple and number of levels to show (up to 10 in each direction).
Independent Up/Down toggles — display only the levels you need.
Label offset control — move labels closer or farther from the price scale.
Fully customizable styling — line color, width, and style (solid, dashed, dotted).
Efficient cleanup logic — lines and labels refresh dynamically on update.
🧩 Perfect For
Futures and index traders tracking tick increments (e.g., ES, NQ, CL).
Measuring quick scalp targets or ATR-based micro-ranges.
Visualizing equidistant price steps from a key breakout or reversal point.
Created by: PumpC Trading Tools
Version: 1.0 (Pine Script v6)
License: Open for personal use — please credit “PumpC Tick Levels Marker” if reused or modified.
PumpC Tick Levels Marker
A precision price-level visualization tool designed for futures and tick-based traders.
Easily mark a single reference price and automatically plot symmetrical tick levels above and below it.
🔍 How It Works
Select your Anchor Price — this acts as the central reference point.
The script automatically plots upward and downward tick levels spaced by your chosen tick multiple.
Labels display tick distance (+/- ticks) and can be offset to the right by a set number of bars for clean alignment near the price scale.
⚙️ Key Features
One-click anchor control — define a single reference price.
Custom tick spacing — choose your tick multiple and number of levels to show (up to 10 in each direction).
Independent Up/Down toggles — display only the levels you need.
Label offset control — move labels closer or farther from the price scale.
Fully customizable styling — line color, width, and style (solid, dashed, dotted).
Efficient cleanup logic — lines and labels refresh dynamically on update.
🧩 Perfect For
Futures and index traders tracking tick increments (e.g., ES, NQ, CL).
Measuring quick scalp targets or ATR-based micro-ranges.
Visualizing equidistant price steps from a key breakout or reversal point.
Created by: PumpC Trading Tools
Version: 1.0 (Pine Script v6)
License: Open for personal use — please credit “PumpC Tick Levels Marker” if reused or modified.
오픈 소스 스크립트
트레이딩뷰의 진정한 정신에 따라, 이 스크립트의 작성자는 이를 오픈소스로 공개하여 트레이더들이 기능을 검토하고 검증할 수 있도록 했습니다. 작성자에게 찬사를 보냅니다! 이 코드는 무료로 사용할 수 있지만, 코드를 재게시하는 경우 하우스 룰이 적용된다는 점을 기억하세요.
면책사항
해당 정보와 게시물은 금융, 투자, 트레이딩 또는 기타 유형의 조언이나 권장 사항으로 간주되지 않으며, 트레이딩뷰에서 제공하거나 보증하는 것이 아닙니다. 자세한 내용은 이용 약관을 참조하세요.
오픈 소스 스크립트
트레이딩뷰의 진정한 정신에 따라, 이 스크립트의 작성자는 이를 오픈소스로 공개하여 트레이더들이 기능을 검토하고 검증할 수 있도록 했습니다. 작성자에게 찬사를 보냅니다! 이 코드는 무료로 사용할 수 있지만, 코드를 재게시하는 경우 하우스 룰이 적용된다는 점을 기억하세요.
면책사항
해당 정보와 게시물은 금융, 투자, 트레이딩 또는 기타 유형의 조언이나 권장 사항으로 간주되지 않으며, 트레이딩뷰에서 제공하거나 보증하는 것이 아닙니다. 자세한 내용은 이용 약관을 참조하세요.