PROTECTED SOURCE SCRIPT
업데이트됨 Advanced Time Technique
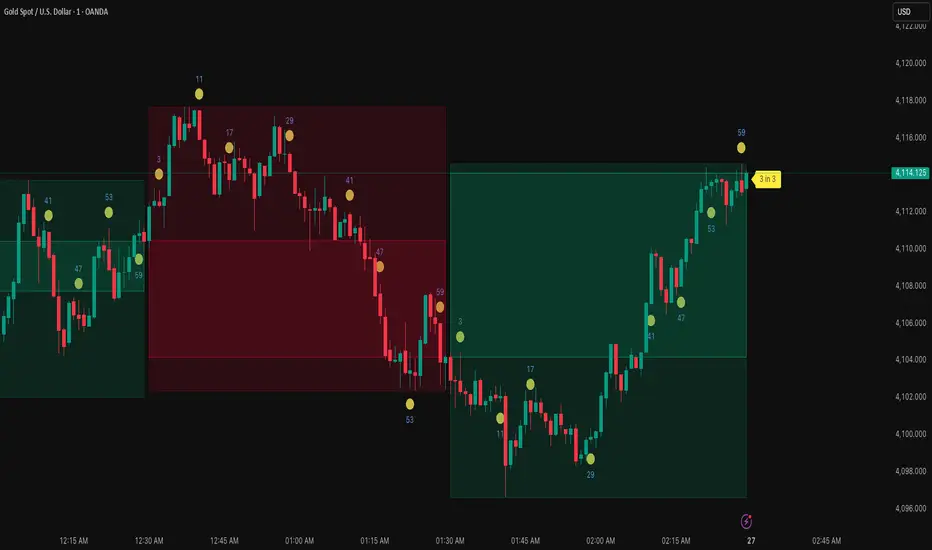
📌 ATT – Advanced Time Technique | Multi-Timeframe Liquidity Map
Advanced Time Technique (ATT) is a price-action based model that identifies mathematically repeating liquidity levels formed by candle count sequences.
These ATT levels often act as reversal zones, continuation points, and liquidity magnets during intraday and scalp trading.
🧠 Inspiration
This indicator is inspired by the concepts shared by TradeWithWill on YouTube(youtube.com/watch?v=r76ShRQf1P0&t=676s), who explores ATT-based behavior
This script is my own implementation and workflow adaptation based on those ideas.
✅ Key Features
✔ Automatic plotting of ATT numbers (3, 11, 17, 29, 41, 47, 53, 59…)
✔ Multi-timeframe support with HTF reference points
✔ Smart Prediction Labels
✔ Candle-based logic — no lagging indicators
✔ Fully customizable colors, styles, and transparency
🧠 What Does ATT Do?
ATT tracks candle cycle counts from a selected higher timeframe, helping traders identify:
✅ Trend continuation opportunities
✅ High-precision entry & exit areas
✅ Liquidity Sweep
Perfect for:
- Intraday + Scalp Trading
- Liquidity / Market Structure Traders
- ICT-style Smart Money Concepts
🕒 Ideal Usage
✅ Scalping
✅ Day Trading
Works best when combined with:
ICT Kill zones, Higher Time Frame Levels, Fair Value Gaps (FVG),Breaker Blocks (BB),Order Blocks (OB)
If you love this indicator ❤️ — leave a comment or follow for upcoming upgrades
Happy Trading! 📈🚀
릴리즈 노트
Removed timeframe selection below 1 hour릴리즈 노트
Added only 3 time frames to select보호된 스크립트입니다
이 스크립트는 비공개 소스로 게시됩니다. 하지만 제한 없이 자유롭게 사용할 수 있습니다 — 여기에서 자세히 알아보기.
면책사항
이 정보와 게시물은 TradingView에서 제공하거나 보증하는 금융, 투자, 거래 또는 기타 유형의 조언이나 권고 사항을 의미하거나 구성하지 않습니다. 자세한 내용은 이용 약관을 참고하세요.
면책사항
이 정보와 게시물은 TradingView에서 제공하거나 보증하는 금융, 투자, 거래 또는 기타 유형의 조언이나 권고 사항을 의미하거나 구성하지 않습니다. 자세한 내용은 이용 약관을 참고하세요.