PROTECTED SOURCE SCRIPT
Absolute Volume Levels MA [AlgoRich]
This script allows you to:
Choose between dynamic or static thresholds to classify the volume of the bars.
Select the type of moving average (SMA, EMA, RMA, or KAMA) and the period for calculating the volume's moving average, making it easier to adapt to different asset behaviors and volatilities.
Configure multiplier factors that determine the intermediate and strong thresholds based on the volume's moving average.
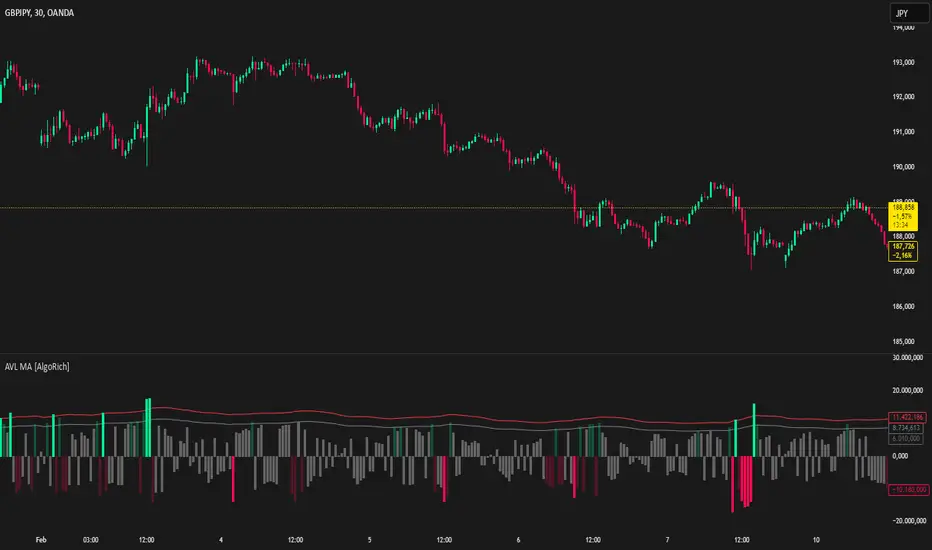
Assign differentiated colors for bullish and bearish bars, depending on whether the volume is weak, intermediate, or strong.
Visualize the classified volume in a histogram, which helps quickly identify the bars with the highest activity.
This flexibility and customization allow the indicator to adapt to various assets and timeframes, providing a robust visual tool for analyzing volume behavior.
Choose between dynamic or static thresholds to classify the volume of the bars.
Select the type of moving average (SMA, EMA, RMA, or KAMA) and the period for calculating the volume's moving average, making it easier to adapt to different asset behaviors and volatilities.
Configure multiplier factors that determine the intermediate and strong thresholds based on the volume's moving average.
Assign differentiated colors for bullish and bearish bars, depending on whether the volume is weak, intermediate, or strong.
Visualize the classified volume in a histogram, which helps quickly identify the bars with the highest activity.
This flexibility and customization allow the indicator to adapt to various assets and timeframes, providing a robust visual tool for analyzing volume behavior.
보호된 스크립트입니다
이 스크립트는 비공개 소스로 게시됩니다. 하지만 이를 자유롭게 제한 없이 사용할 수 있습니다 – 자세한 내용은 여기에서 확인하세요.
면책사항
해당 정보와 게시물은 금융, 투자, 트레이딩 또는 기타 유형의 조언이나 권장 사항으로 간주되지 않으며, 트레이딩뷰에서 제공하거나 보증하는 것이 아닙니다. 자세한 내용은 이용 약관을 참조하세요.
보호된 스크립트입니다
이 스크립트는 비공개 소스로 게시됩니다. 하지만 이를 자유롭게 제한 없이 사용할 수 있습니다 – 자세한 내용은 여기에서 확인하세요.
면책사항
해당 정보와 게시물은 금융, 투자, 트레이딩 또는 기타 유형의 조언이나 권장 사항으로 간주되지 않으며, 트레이딩뷰에서 제공하거나 보증하는 것이 아닙니다. 자세한 내용은 이용 약관을 참조하세요.