OPEN-SOURCE SCRIPT
CC - Asset vs Asset/ETHUSD or /BTCUSD
Overview:
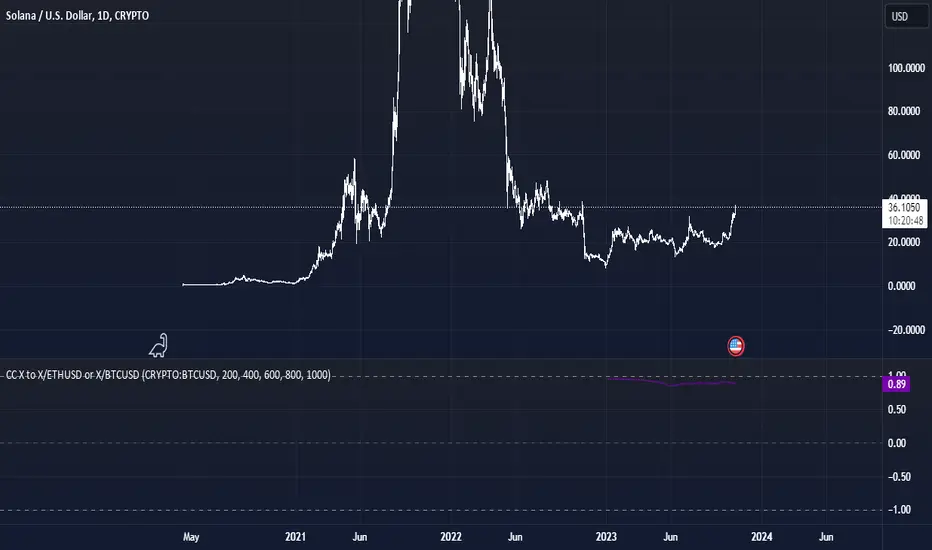
This indicator measures the correlation between the asset currently displayed on the chart and the ratio of that asset to either ETHUSD or BTCUSD. The correlation is computed using the closing prices of the assets over various lengths, and the final plotted value is an average of these correlations.
Features:
Comparison Asset Selection: The user can select between ETHUSD or BTCUSD as the comparison asset. This determines which cryptocurrency the charted asset will be compared against.
Multiple Length Inputs: The user can define up to five different lengths over which the correlation is computed. This feature allows users to analyze the correlation over different time frames, providing a comprehensive view.
Average Correlation Plot: The indicator doesn't just plot the correlation for a single length; instead, it calculates the correlation for all five lengths and then computes their average. This average correlation is what's plotted on the chart, giving a consolidated measure of the asset's correlation with its ratio to either ETHUSD or BTCUSD.
How It Works:
Fetching Data: The indicator first fetches the closing price of the selected comparison asset, be it ETHUSD or BTCUSD.
Calculating the Ratio: The ratio of the chart asset to the selected comparison asset (either ETHUSD or BTCUSD) is calculated.
Correlation Computation: The correlation between the close prices of the charted asset and the previously calculated ratio is determined over the user-defined lengths.
Averaging: The correlations computed for all five lengths are averaged to get a single value that represents the average correlation.
Plotting: The average correlation is plotted on the chart, with horizontal lines at 1, 0, and -1 to provide a visual reference. A value of 1 indicates perfect positive correlation, -1 indicates perfect negative correlation, and 0 indicates no correlation.
Use Cases:
This indicator is useful for traders and analysts wanting to understand how closely the price movements of an asset follow the movements of its ratio to major cryptocurrencies like ETHUSD or BTCUSD. It helps in assessing the relative strength or weakness of an asset compared to these major cryptocurrencies over multiple time frames.
Important Note: Works on 1D timeframe for most assets. If you get an error try to use the 1D timeframe, or fill all the 5 lengths.
오픈 소스 스크립트
트레이딩뷰의 진정한 정신에 따라, 이 스크립트의 작성자는 이를 오픈소스로 공개하여 트레이더들이 기능을 검토하고 검증할 수 있도록 했습니다. 작성자에게 찬사를 보냅니다! 이 코드는 무료로 사용할 수 있지만, 코드를 재게시하는 경우 하우스 룰이 적용된다는 점을 기억하세요.
🔍 Access Investing Strategies & Indicators
📊 whop.com/marktquant
🌐 marktquant.com
Nothing shared on this page constitutes financial advice. All information, tools, and analyses are provided solely for informational and educational purposes.
📊 whop.com/marktquant
🌐 marktquant.com
Nothing shared on this page constitutes financial advice. All information, tools, and analyses are provided solely for informational and educational purposes.
면책사항
해당 정보와 게시물은 금융, 투자, 트레이딩 또는 기타 유형의 조언이나 권장 사항으로 간주되지 않으며, 트레이딩뷰에서 제공하거나 보증하는 것이 아닙니다. 자세한 내용은 이용 약관을 참조하세요.