OPEN-SOURCE SCRIPT
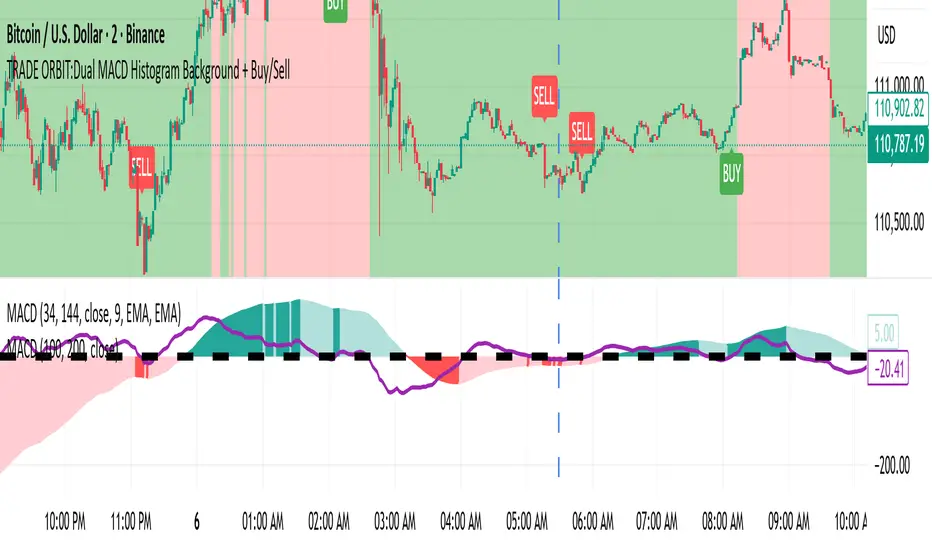
TRADE ORBIT:Dual MACD Histogram Background + Buy/Sell
Description:
This indicator combines two MACD systems to provide clear trend, buy/sell signals, and identifies potential discount and premium zones for smarter entries and exits.
Features:
MACD #1 (100, 200, 50) – Trend & Background Coloring
Histogram > 0 → Green background (Bullish trend)
Histogram < 0 → Red background (Bearish trend)
MACD #2 (34, 144, 9) – Buy/Sell Signals
Buy Signal: Histogram crosses above zero and MACD #1 background is green
Sell Signal: Histogram crosses below zero and MACD #1 background is red
Signals are plotted as tiny labels directly on the chart
Discount & Premium Zones
Discount Zone: Price below MACD #1 slow EMA → highlighted in green
Premium Zone: Price above MACD #1 slow EMA → highlighted in red
Helps identify “cheap” (potential buy) and “expensive” (potential sell) areas relative to trend
Reference Plots (Optional)
MACD #1 & #2 histograms plotted as columns for visual confirmation
Usage:
Use MACD #1 background to identify the prevailing trend.
Wait for MACD #2 cross signals aligned with trend for buy/sell confirmation.
Discount and premium zones help time entries and exits more efficiently.
Ideal For:
Swing traders and position traders who want to combine trend-following signals with overbought/oversold zones.
오픈 소스 스크립트
진정한 트레이딩뷰 정신에 따라 이 스크립트 작성자는 트레이더가 기능을 검토하고 검증할 수 있도록 오픈소스로 공개했습니다. 작성자에게 찬사를 보냅니다! 무료로 사용할 수 있지만 코드를 다시 게시할 경우 하우스 룰이 적용된다는 점을 기억하세요.
면책사항
이 정보와 게시물은 TradingView에서 제공하거나 보증하는 금융, 투자, 거래 또는 기타 유형의 조언이나 권고 사항을 의미하거나 구성하지 않습니다. 자세한 내용은 이용 약관을 참고하세요.
오픈 소스 스크립트
진정한 트레이딩뷰 정신에 따라 이 스크립트 작성자는 트레이더가 기능을 검토하고 검증할 수 있도록 오픈소스로 공개했습니다. 작성자에게 찬사를 보냅니다! 무료로 사용할 수 있지만 코드를 다시 게시할 경우 하우스 룰이 적용된다는 점을 기억하세요.
면책사항
이 정보와 게시물은 TradingView에서 제공하거나 보증하는 금융, 투자, 거래 또는 기타 유형의 조언이나 권고 사항을 의미하거나 구성하지 않습니다. 자세한 내용은 이용 약관을 참고하세요.