INVITE-ONLY SCRIPT
Gapup Advanced (B/S)
This indicator provides you support and resistance line for Intraday trading. We have made the calculations using the historical data of (EMA 10, open ,high,low,close,52week high,52w low). We tried to capture the rapid moment of stock depending on the previous day values and EMA 10. Unlike the lagging indicator which changes the values periodically.
This is a Leading Indicator which uses TRADINGVIEW's powerful code "Resolution "-ie the indicator values will not change for the intraday, though you change to any timeframe.
Our indicator will take care of the work of conditioning and plotting and plot only if it matches all the criteria. So plotting of EMA is not required. If you want to plot EMA manually ,I would (recommend tf=15min,10ema) .
How to use this Indicator ?
When we can go long?
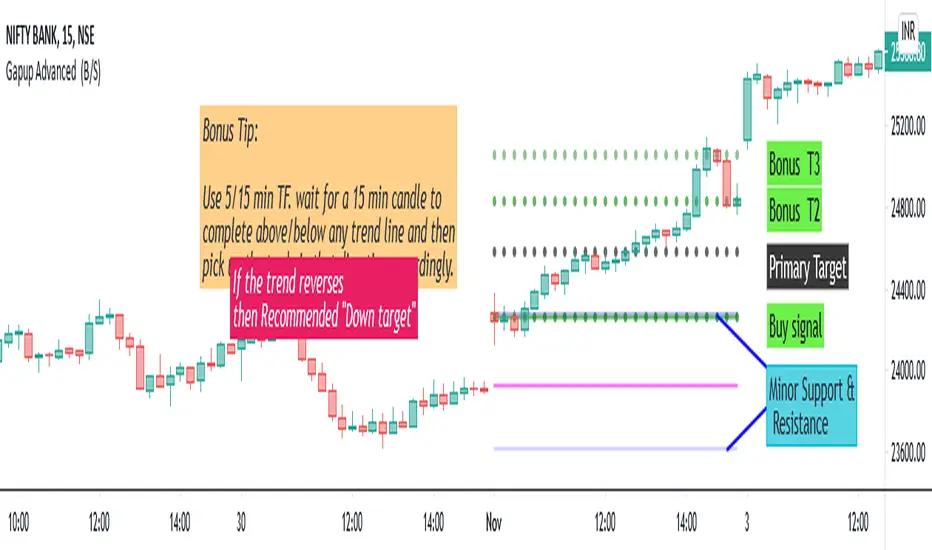
When you get a green line along with dot, go for BUY. Once the candle hits our target (i.e the black dotted line) close the trade and book your profits. And once the dot in the green line is off ,it means the stock will not go beyond primary target. When the dot in the green line is off, it means it has the possibility to go DOWN further.
Bonus Tip: If the 15 min candle closes above any of the trend line and in the next candle if it takes support from that line itself then it has the possibility to go up further.
When we can go short ?
When you get a red line along with dot, go for SELL. Once the candle hits our target (i.e the black dotted line) close the trade and book your profits. And once the dot in the red line is off , it means the stock will not go beyond primary target. When the dot in the red line is off, it means it has the possibility to go UP further.
Bonus Tip: If the 15 min candle closes below any of the trend line and in the next candle if it faces the resistance from that line itself then it has the possibility to go down further.
The other 2 green dotted lines/ red dotted lines are Bonus targets 2 and 3.
ie. The trend may reverse @ any point above the primary target in case of buy.
Ie. The trend may reverse @ any point below the primary target in case of sell.
To be a Consistent Profitable Trader:
Always aim for the one adjacent level above or below the current level.
Unique Feature - "THE PINK LINE"
In case of buy call, if the trend reverses we give you a recommended down target.
In case of sell call , if the trend reverses we give you a recommended up target.
Minor Support & Resistance line:
Also if the trend reverses,
In case of buy, minor support and resistance are present below.
In case of sell, minor support and resistance are present above.
It can used to trade in Options, futures ,equity. Suitable for all high moment stocks,indices, commodities.
Final Bonus Tip:
I always recommend for every trader to trade with min stock quantity eg:1-10 with any indicator/ strategy. Then you can choose to trade in lots in futures and options.
It is useful for scalpers and Intraday traders.
Recommended Time Frame : 5/15 min.
Suitable for all stocks,indices, commodities .
This is a Leading Indicator which uses TRADINGVIEW's powerful code "Resolution "-ie the indicator values will not change for the intraday, though you change to any timeframe.
Our indicator will take care of the work of conditioning and plotting and plot only if it matches all the criteria. So plotting of EMA is not required. If you want to plot EMA manually ,I would (recommend tf=15min,10ema) .
How to use this Indicator ?
When we can go long?
When you get a green line along with dot, go for BUY. Once the candle hits our target (i.e the black dotted line) close the trade and book your profits. And once the dot in the green line is off ,it means the stock will not go beyond primary target. When the dot in the green line is off, it means it has the possibility to go DOWN further.
Bonus Tip: If the 15 min candle closes above any of the trend line and in the next candle if it takes support from that line itself then it has the possibility to go up further.
When we can go short ?
When you get a red line along with dot, go for SELL. Once the candle hits our target (i.e the black dotted line) close the trade and book your profits. And once the dot in the red line is off , it means the stock will not go beyond primary target. When the dot in the red line is off, it means it has the possibility to go UP further.
Bonus Tip: If the 15 min candle closes below any of the trend line and in the next candle if it faces the resistance from that line itself then it has the possibility to go down further.
The other 2 green dotted lines/ red dotted lines are Bonus targets 2 and 3.
ie. The trend may reverse @ any point above the primary target in case of buy.
Ie. The trend may reverse @ any point below the primary target in case of sell.
To be a Consistent Profitable Trader:
Always aim for the one adjacent level above or below the current level.
Unique Feature - "THE PINK LINE"
In case of buy call, if the trend reverses we give you a recommended down target.
In case of sell call , if the trend reverses we give you a recommended up target.
Minor Support & Resistance line:
Also if the trend reverses,
In case of buy, minor support and resistance are present below.
In case of sell, minor support and resistance are present above.
It can used to trade in Options, futures ,equity. Suitable for all high moment stocks,indices, commodities.
Final Bonus Tip:
I always recommend for every trader to trade with min stock quantity eg:1-10 with any indicator/ strategy. Then you can choose to trade in lots in futures and options.
It is useful for scalpers and Intraday traders.
Recommended Time Frame : 5/15 min.
Suitable for all stocks,indices, commodities .
초대 전용 스크립트
이 스크립트는 작성자가 승인한 사용자만 접근할 수 있습니다. 사용하려면 요청 후 승인을 받아야 하며, 일반적으로 결제 후에 허가가 부여됩니다. 자세한 내용은 아래 작성자의 안내를 따르거나 teamGapup에게 직접 문의하세요.
트레이딩뷰는 스크립트의 작동 방식을 충분히 이해하고 작성자를 완전히 신뢰하지 않는 이상, 해당 스크립트에 비용을 지불하거나 사용하는 것을 권장하지 않습니다. 커뮤니티 스크립트에서 무료 오픈소스 대안을 찾아보실 수도 있습니다.
작성자 지시 사항
면책사항
해당 정보와 게시물은 금융, 투자, 트레이딩 또는 기타 유형의 조언이나 권장 사항으로 간주되지 않으며, 트레이딩뷰에서 제공하거나 보증하는 것이 아닙니다. 자세한 내용은 이용 약관을 참조하세요.