OPEN-SOURCE SCRIPT
Voluminati: Uncovering Market Secrets
Voluminati: Uncovering Market Secrets
Overview:
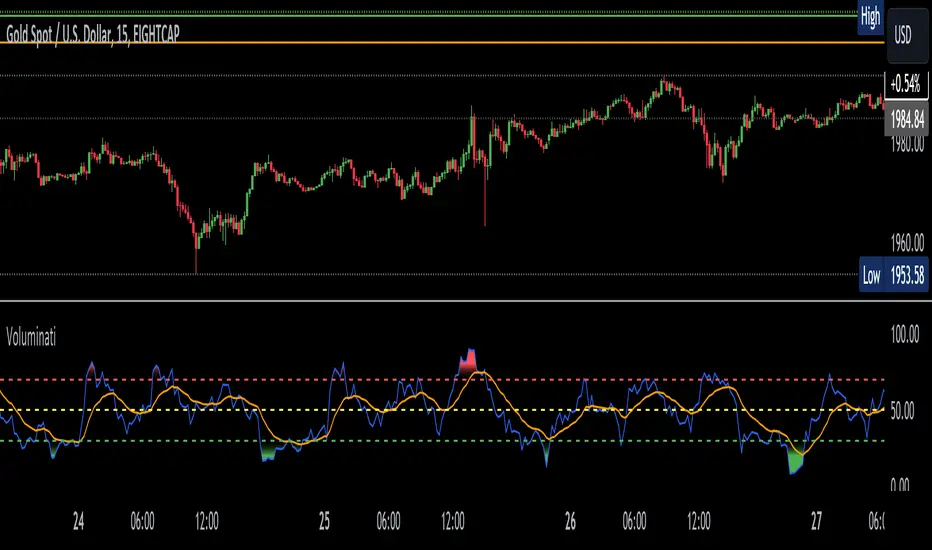
The Voluminati indicator dives deep into the secrets of trading volume, providing traders with unique insights into the market's strength and direction. This advanced tool visualizes the Relative Strength Index (RSI) of trading volume alongside the traditional RSI of price, presenting an enriched perspective on market dynamics.
Features:
Volume RSI: A unique twist on the traditional RSI, the Volume RSI measures the momentum of trading volume. This can help identify periods of increasing buying or selling pressure.
Traditional RSI: The renowned momentum oscillator that measures the speed and change of price movements. Useful for identifying overbought or oversold conditions.
Moving Averages: Both the Volume RSI and traditional RSI come with optional moving averages. These can be toggled on or off and are customizable in type (SMA or EMA) and length.
Overbought & Oversold Fills: Visual aids that highlight regions where the Volume RSI is in overbought (above 70) or oversold (below 30) territories. These fills help traders quickly identify potential reversal zones.
How to Use:
Look for divergence between the Volume RSI and price, which can indicate potential reversals.
When the Volume RSI moves above 70, it might indicate overbought conditions, and when it moves below 30, it might indicate oversold conditions.
The optional moving averages can be used to identify potential crossover signals or to smooth out the oscillators for a clearer trend view.
Customizations:
Toggle the display of the traditional RSI and its moving average.
Choose the type (SMA/EMA) and length for both the Volume RSI and traditional RSI moving averages.
Note: Like all indicators, the Voluminati is best used in conjunction with other tools and analysis techniques. Always use proper risk management.
Overview:
The Voluminati indicator dives deep into the secrets of trading volume, providing traders with unique insights into the market's strength and direction. This advanced tool visualizes the Relative Strength Index (RSI) of trading volume alongside the traditional RSI of price, presenting an enriched perspective on market dynamics.
Features:
Volume RSI: A unique twist on the traditional RSI, the Volume RSI measures the momentum of trading volume. This can help identify periods of increasing buying or selling pressure.
Traditional RSI: The renowned momentum oscillator that measures the speed and change of price movements. Useful for identifying overbought or oversold conditions.
Moving Averages: Both the Volume RSI and traditional RSI come with optional moving averages. These can be toggled on or off and are customizable in type (SMA or EMA) and length.
Overbought & Oversold Fills: Visual aids that highlight regions where the Volume RSI is in overbought (above 70) or oversold (below 30) territories. These fills help traders quickly identify potential reversal zones.
How to Use:
Look for divergence between the Volume RSI and price, which can indicate potential reversals.
When the Volume RSI moves above 70, it might indicate overbought conditions, and when it moves below 30, it might indicate oversold conditions.
The optional moving averages can be used to identify potential crossover signals or to smooth out the oscillators for a clearer trend view.
Customizations:
Toggle the display of the traditional RSI and its moving average.
Choose the type (SMA/EMA) and length for both the Volume RSI and traditional RSI moving averages.
Note: Like all indicators, the Voluminati is best used in conjunction with other tools and analysis techniques. Always use proper risk management.
오픈 소스 스크립트
트레이딩뷰의 진정한 정신에 따라, 이 스크립트의 작성자는 이를 오픈소스로 공개하여 트레이더들이 기능을 검토하고 검증할 수 있도록 했습니다. 작성자에게 찬사를 보냅니다! 이 코드는 무료로 사용할 수 있지만, 코드를 재게시하는 경우 하우스 룰이 적용된다는 점을 기억하세요.
면책사항
해당 정보와 게시물은 금융, 투자, 트레이딩 또는 기타 유형의 조언이나 권장 사항으로 간주되지 않으며, 트레이딩뷰에서 제공하거나 보증하는 것이 아닙니다. 자세한 내용은 이용 약관을 참조하세요.
오픈 소스 스크립트
트레이딩뷰의 진정한 정신에 따라, 이 스크립트의 작성자는 이를 오픈소스로 공개하여 트레이더들이 기능을 검토하고 검증할 수 있도록 했습니다. 작성자에게 찬사를 보냅니다! 이 코드는 무료로 사용할 수 있지만, 코드를 재게시하는 경우 하우스 룰이 적용된다는 점을 기억하세요.
면책사항
해당 정보와 게시물은 금융, 투자, 트레이딩 또는 기타 유형의 조언이나 권장 사항으로 간주되지 않으며, 트레이딩뷰에서 제공하거나 보증하는 것이 아닙니다. 자세한 내용은 이용 약관을 참조하세요.