PROTECTED SOURCE SCRIPT
RSI de Loquy
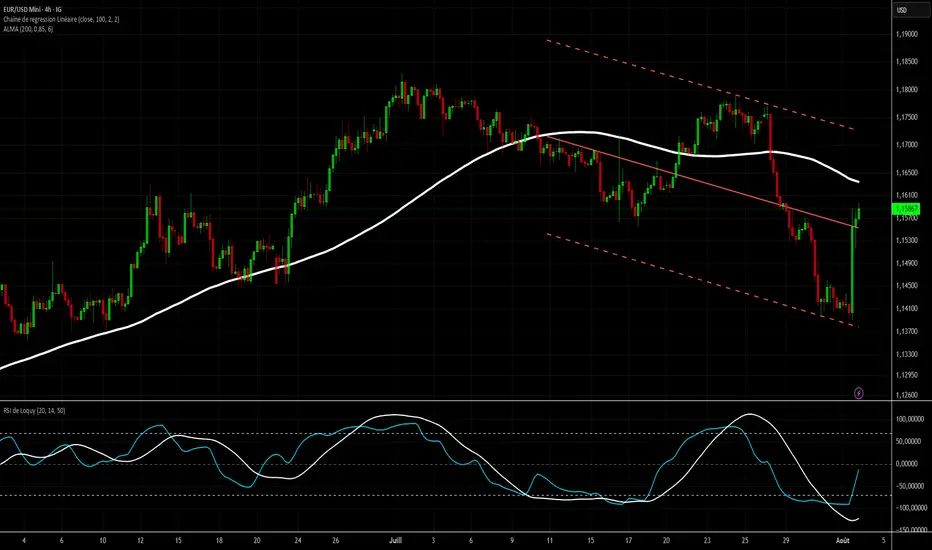
Indicator Description: RSI de Loquy
This custom indicator blends the power of the Relative Strength Index (RSI) with the Hull Moving Average (HMA), enhanced by a linear regression to reveal underlying momentum trends.
How It Works:
The RSI is calculated not on price directly, but on the HMA, offering a smoother and more responsive signal.
The RSI is remapped to a -100 to +100 scale for more intuitive reading:
+100 = extreme oversold
-100 = extreme overbought
A linear regression line is plotted over the rescaled RSI to highlight trend direction and strength.
Usage Tips:
Reversed overbought/oversold levels:
Above +70 = potential oversold condition
Below -70 = potential overbought condition
The white regression line helps confirm trend shifts or momentum continuation.
⚙️ Customizable Inputs:
HMA period
RSI length
Regression length
보호된 스크립트입니다
이 스크립트는 비공개 소스로 게시됩니다. 하지만 이를 자유롭게 제한 없이 사용할 수 있습니다 – 자세한 내용은 여기에서 확인하세요.
면책사항
해당 정보와 게시물은 금융, 투자, 트레이딩 또는 기타 유형의 조언이나 권장 사항으로 간주되지 않으며, 트레이딩뷰에서 제공하거나 보증하는 것이 아닙니다. 자세한 내용은 이용 약관을 참조하세요.
면책사항
해당 정보와 게시물은 금융, 투자, 트레이딩 또는 기타 유형의 조언이나 권장 사항으로 간주되지 않으며, 트레이딩뷰에서 제공하거나 보증하는 것이 아닙니다. 자세한 내용은 이용 약관을 참조하세요.