OPEN-SOURCE SCRIPT
업데이트됨 RS - Relative Strength Score
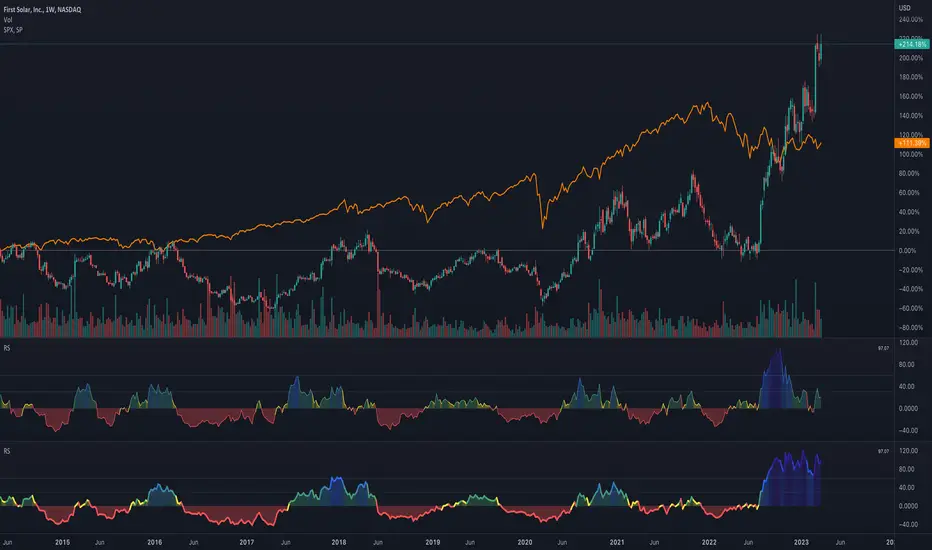
Relative strength (RS) is a measure of a stock's price performance relative to the overall market. It is calculated by dividing the stock's price change over a specified period by the market's price change over the same period. A stock with a high RS has outperformed the market, while a stock with a low RS has underperformed. (Stock can any asset that can be compared to a reference index like as Bitcoin, Altcoins etc ...)
Here are some advantages:
- Provides a measure of a stock's performance relative to a benchmark index or sector, allowing for a more accurate comparison of performance.
- Helps identify stocks with strong price momentum that are likely to continue outperforming the market in the short to medium term.
- Allows investors to identify the strongest performers within a particular sector or industry.
- Provides a quantitative and objective measure of a stock's performance, which can help reduce bias in investment decisions.
- Can be used in conjunction with other technical indicators and chart analysis to identify potentially profitable trades.
- Helps investors make more informed decisions by providing a more comprehensive picture of a stock's performance.
How to use it:
- The indicator can be used in daily and weekly timeframes.
- Check, if the default reference index is suited for your asset (Settings) The default is the combination of S&P500+Nasdaq+Dow Jones. For Crypto, it could be TOTAL (ticker for total stock market), for German stocks it could be DAX.
- Decide (settings), if you want to see the RS based on annual calculation (IBD style) or based only for the last quarter
Color coding:
- Red: Stock is performing worse than index (RS < 0)
- Yellow: Stock get momentum, starting to perform better than index (RS > 0)
- Green: Stock is outperforming the index
- Blue: Stock is a shooting star compared to index
- When RS turns positive and stays there, it could be an indication for an outbreak (maybe into a stage 2)
No financial advise. For education purposes only.
릴리즈 노트
version 2Obsolete
- deleted annual vs quarterly selection, now only annual is being used
- deleted source selection, close is now always been used
New
- Select Relative Strength based on index, i.e. selected reference ticker
- Select Relative Strength based on sector, automatically calculated using sector ETFs
- Table is showing the asset type and sector with the corresponding RS values
오픈 소스 스크립트
트레이딩뷰의 진정한 정신에 따라, 이 스크립트의 작성자는 이를 오픈소스로 공개하여 트레이더들이 기능을 검토하고 검증할 수 있도록 했습니다. 작성자에게 찬사를 보냅니다! 이 코드는 무료로 사용할 수 있지만, 코드를 재게시하는 경우 하우스 룰이 적용된다는 점을 기억하세요.
면책사항
해당 정보와 게시물은 금융, 투자, 트레이딩 또는 기타 유형의 조언이나 권장 사항으로 간주되지 않으며, 트레이딩뷰에서 제공하거나 보증하는 것이 아닙니다. 자세한 내용은 이용 약관을 참조하세요.
오픈 소스 스크립트
트레이딩뷰의 진정한 정신에 따라, 이 스크립트의 작성자는 이를 오픈소스로 공개하여 트레이더들이 기능을 검토하고 검증할 수 있도록 했습니다. 작성자에게 찬사를 보냅니다! 이 코드는 무료로 사용할 수 있지만, 코드를 재게시하는 경우 하우스 룰이 적용된다는 점을 기억하세요.
면책사항
해당 정보와 게시물은 금융, 투자, 트레이딩 또는 기타 유형의 조언이나 권장 사항으로 간주되지 않으며, 트레이딩뷰에서 제공하거나 보증하는 것이 아닙니다. 자세한 내용은 이용 약관을 참조하세요.