OPEN-SOURCE SCRIPT
GL_Prev Week High
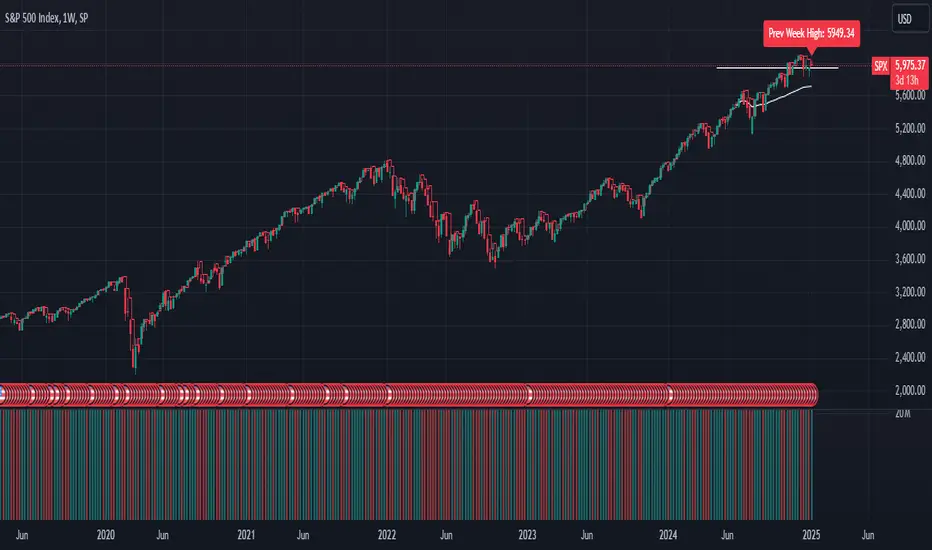
The GL_Prev Week High Indicator is a powerful tool designed to enhance your trading analysis by displaying the previous week's high price directly on your chart. With clear and customizable visuals, this indicator helps traders quickly identify critical price levels, enabling more informed decision-making.
Key Features:
Previous Week's High Line:
Displays the previous week's high as a red line on your chart for easy reference.
Customizable Horizontal Line:
Includes a white horizontal line for enhanced clarity, with adjustable length, color, and width settings.
All-Time High Tracking:
Automatically tracks the all-time high from the chart's history and places a dynamic label above it.
Real-Time Updates:
The indicator updates in real-time to ensure accuracy as new bars are added.
User Inputs for Personalization:
Adjust the left and right span of the horizontal line.
Customize line width and color to suit your preferences.
Use Case:
This indicator is ideal for traders looking to integrate the previous week's high as a key support or resistance level in their trading strategy. Whether you are analyzing trends, identifying breakout zones, or planning entry/exit points, this tool provides valuable insights directly on the chart.
How to Use:
Add the indicator to your chart.
Customize the settings (line length, width, and color) through the input panel to match your preferences.
Use the red line to track the previous week's high and the label to monitor all-time highs effortlessly.
License:
This script is shared under the Mozilla Public License 2.0. Feel free to use and adapt the script as per the license terms.
오픈 소스 스크립트
트레이딩뷰의 진정한 정신에 따라, 이 스크립트의 작성자는 이를 오픈소스로 공개하여 트레이더들이 기능을 검토하고 검증할 수 있도록 했습니다. 작성자에게 찬사를 보냅니다! 이 코드는 무료로 사용할 수 있지만, 코드를 재게시하는 경우 하우스 룰이 적용된다는 점을 기억하세요.
면책사항
해당 정보와 게시물은 금융, 투자, 트레이딩 또는 기타 유형의 조언이나 권장 사항으로 간주되지 않으며, 트레이딩뷰에서 제공하거나 보증하는 것이 아닙니다. 자세한 내용은 이용 약관을 참조하세요.
오픈 소스 스크립트
트레이딩뷰의 진정한 정신에 따라, 이 스크립트의 작성자는 이를 오픈소스로 공개하여 트레이더들이 기능을 검토하고 검증할 수 있도록 했습니다. 작성자에게 찬사를 보냅니다! 이 코드는 무료로 사용할 수 있지만, 코드를 재게시하는 경우 하우스 룰이 적용된다는 점을 기억하세요.
면책사항
해당 정보와 게시물은 금융, 투자, 트레이딩 또는 기타 유형의 조언이나 권장 사항으로 간주되지 않으며, 트레이딩뷰에서 제공하거나 보증하는 것이 아닙니다. 자세한 내용은 이용 약관을 참조하세요.