INVITE-ONLY SCRIPT
업데이트됨 MTF BB%+ [Overlay] [Intromoto]
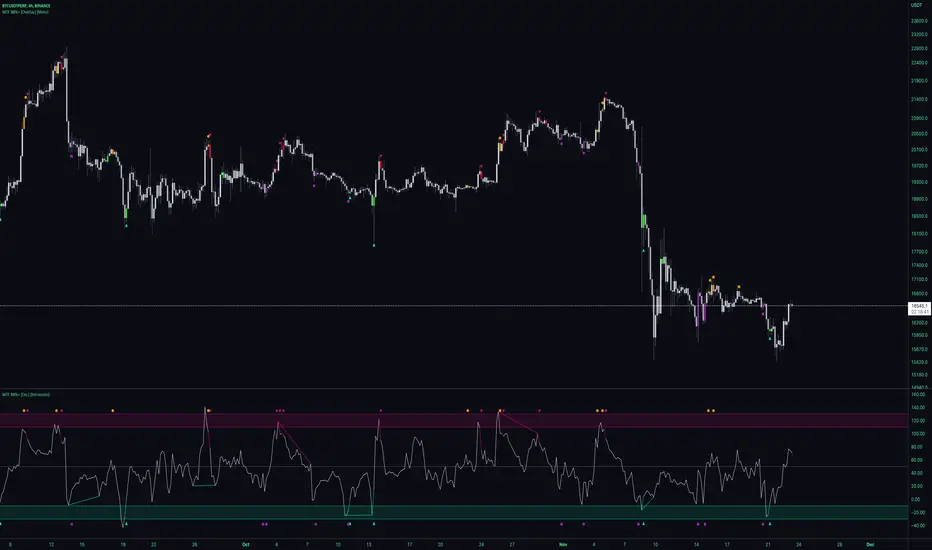
This indicator is based around BB%, essentially showing where deviations are within price over time. This is the overlay version, better to see the precise candle signals.
Plotshapes are printed when exiting extremes of the deviations, back towards the mean.
Arrows indicate an increased likelihood of price reverting direction. Red arrow =bearish, green arrow = bullish. Dots below candles = bullish, above candles = bearish.
Dots on the top and bottom of the candles show a sub level of reversion that would be perhaps less extreme than when price reenters the norm from the normal standard deviation.
Users can also change the timeframe of the indicator for high time frame signals.
Barcolors for plotshapes included.
DM for access
Thanks
릴리즈 노트
Added user inputs for plotshape variables릴리즈 노트
Added ability to change MA type릴리즈 노트
Removed oscillator plots. Prevented overlapping signals릴리즈 노트
Added alerts릴리즈 노트
Removed extraneous data points from oscillator version. Updated to v5.릴리즈 노트
Added Alerts for Purple / Orange plotshapes초대 전용 스크립트
이 스크립트는 작성자가 승인한 사용자만 접근할 수 있습니다. 사용하려면 요청을 보내고 승인을 받아야 합니다. 일반적으로 결제 후에 승인이 이루어집니다. 자세한 내용은 아래 작성자의 지침을 따르거나 Intromoto에게 직접 문의하세요.
트레이딩뷰는 스크립트 작성자를 완전히 신뢰하고 스크립트 작동 방식을 이해하지 않는 한 스크립트 비용을 지불하거나 사용하지 않는 것을 권장하지 않습니다. 무료 오픈소스 대체 스크립트는 커뮤니티 스크립트에서 찾을 수 있습니다.
작성자 지시 사항
DM for access
경고: 액세스를 요청하기 앞서 초대 전용 스크립트에 대한 가이드를 읽어주세요.
DM for access.
Follow on Twitter for updates.
One time fee, no subscription
twitter.com/IntroMoto
Follow on Twitter for updates.
One time fee, no subscription
twitter.com/IntroMoto
면책사항
이 정보와 게시물은 TradingView에서 제공하거나 보증하는 금융, 투자, 거래 또는 기타 유형의 조언이나 권고 사항을 의미하거나 구성하지 않습니다. 자세한 내용은 이용 약관을 참고하세요.
초대 전용 스크립트
이 스크립트는 작성자가 승인한 사용자만 접근할 수 있습니다. 사용하려면 요청을 보내고 승인을 받아야 합니다. 일반적으로 결제 후에 승인이 이루어집니다. 자세한 내용은 아래 작성자의 지침을 따르거나 Intromoto에게 직접 문의하세요.
트레이딩뷰는 스크립트 작성자를 완전히 신뢰하고 스크립트 작동 방식을 이해하지 않는 한 스크립트 비용을 지불하거나 사용하지 않는 것을 권장하지 않습니다. 무료 오픈소스 대체 스크립트는 커뮤니티 스크립트에서 찾을 수 있습니다.
작성자 지시 사항
DM for access
경고: 액세스를 요청하기 앞서 초대 전용 스크립트에 대한 가이드를 읽어주세요.
DM for access.
Follow on Twitter for updates.
One time fee, no subscription
twitter.com/IntroMoto
Follow on Twitter for updates.
One time fee, no subscription
twitter.com/IntroMoto
면책사항
이 정보와 게시물은 TradingView에서 제공하거나 보증하는 금융, 투자, 거래 또는 기타 유형의 조언이나 권고 사항을 의미하거나 구성하지 않습니다. 자세한 내용은 이용 약관을 참고하세요.