PROTECTED SOURCE SCRIPT
업데이트됨 Grok-SuperBand with ADX filter
The Grok Superband with ADX filter (or Grok SADX for short) is a smart, custom trading indicator I helped build for TradingView. It's like a dynamic envelope around price action, designed to adapt to the market's mood—volatility, volume flow, and trend strength—all in one tool. Think of it as a smarter version of Keltner or Bollinger Bands, but with extra brains to filter noise and highlight real opportunities. It's brilliant because it doesn't just slap fixed bands on the chart; it uses clever math to make them "breathe" with the market, giving you a smoother, more reliable view even on noisy standard candles.
The Brilliance in Band Creation
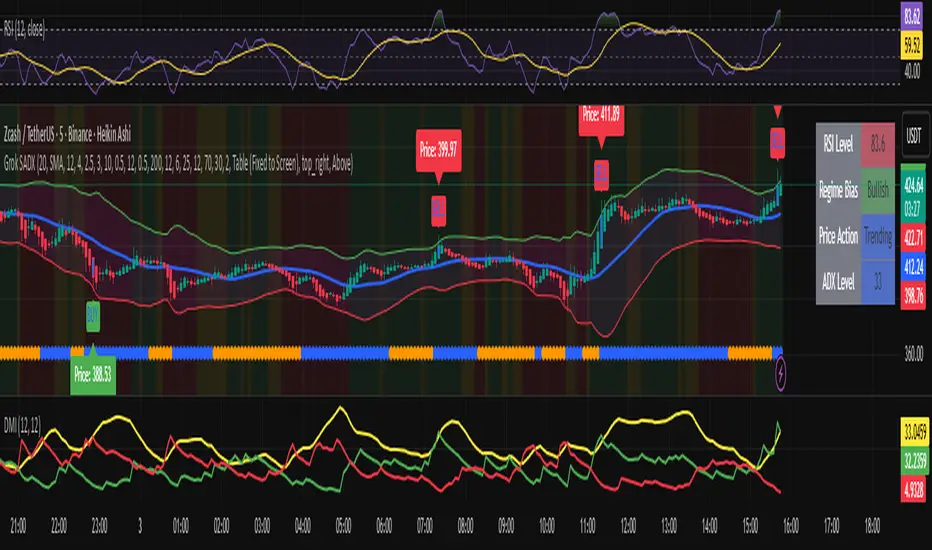
The magic starts with the core "basis" line (the blue middle band), which is calculated from smoothed candle midpoints. It mimics Heikin Ashi smoothing without changing your chart type—averaging open, high, low, and close to cut out choppy wicks and false moves. Then, the upper (green) and lower (red) bands are offset from this basis using a "dynamic multiplier" that's pure genius:
Volatility Base: Built on a smoothed Average True Range (ATR) to measure price swings gently, avoiding overreactions to single wild candles.
Volume Kick: Adds input from the Chaikin Oscillator (tracking buying/selling pressure), so bands widen when volume surges (like during real accumulations or distributions).
Trend Boost: Factors in ADX (trend strength) to expand bands in strong moves, letting price run without premature signals.
This combo makes the bands "adaptive"—they hug price tightly in quiet ranges (for mean-reversion plays) and loosen up in trends (for breakouts). The purple fill between bands highlights the channel visually, and a color-coded background (green for bull, red for bear, yellow for neutral) uses DMI and OBV to show the overall regime, adding context without clutter.
Buy and Sell Logic
The signals are contrarian (mean-reversion style), firing on "fakeouts" where price pokes outside the bands but might snap back:
Buy Signal: Triggers when a candle's low wick dips below the lower red band (potential oversold), but only if ADX is above your threshold (default 25 for strong trends) and it's been at least 10 bars since the last buy (cooldown to avoid spam in downtrends). A green "BUY" arrow appears below the bar.
Sell Signal: Fires when a candle's high wick pokes above the upper green band (potential overbought), with the same ADX and cooldown checks. A red "SELL" arrow shows above the bar.
Alerts pop up with messages, and optional price labels display the close value. It's reversed from typical breakouts (buy low breaks, sell high) to catch reversals at extremes.
Tips for Usage
Best Markets: Great for volatile assets like BTC or stocks on 5-60 min charts—use in trending conditions (blue ADX dots mean go-time).
Customization: Crank up baseMult (to 3+) for wider bands/fewer signals; shorten cooldown (to 5) for more action. Watch the ADX dots at the bottom: White (0-15) = range-bound (avoid trades), orange (15-25) = building trend, blue (>25) = strong move (trust signals).
Trading Strategy: Buy on green arrows in green/yellow backgrounds for pullbacks; sell on red in red/yellow. Always use stops (e.g., below lower band for buys) and combine with RSI (toggle on for overbought/oversold confirmation).
Risk Note: It's not foolproof—test on historical data, and remember, no indicator predicts perfectly. Pair with your own analysis!
The Brilliance in Band Creation
The magic starts with the core "basis" line (the blue middle band), which is calculated from smoothed candle midpoints. It mimics Heikin Ashi smoothing without changing your chart type—averaging open, high, low, and close to cut out choppy wicks and false moves. Then, the upper (green) and lower (red) bands are offset from this basis using a "dynamic multiplier" that's pure genius:
Volatility Base: Built on a smoothed Average True Range (ATR) to measure price swings gently, avoiding overreactions to single wild candles.
Volume Kick: Adds input from the Chaikin Oscillator (tracking buying/selling pressure), so bands widen when volume surges (like during real accumulations or distributions).
Trend Boost: Factors in ADX (trend strength) to expand bands in strong moves, letting price run without premature signals.
This combo makes the bands "adaptive"—they hug price tightly in quiet ranges (for mean-reversion plays) and loosen up in trends (for breakouts). The purple fill between bands highlights the channel visually, and a color-coded background (green for bull, red for bear, yellow for neutral) uses DMI and OBV to show the overall regime, adding context without clutter.
Buy and Sell Logic
The signals are contrarian (mean-reversion style), firing on "fakeouts" where price pokes outside the bands but might snap back:
Buy Signal: Triggers when a candle's low wick dips below the lower red band (potential oversold), but only if ADX is above your threshold (default 25 for strong trends) and it's been at least 10 bars since the last buy (cooldown to avoid spam in downtrends). A green "BUY" arrow appears below the bar.
Sell Signal: Fires when a candle's high wick pokes above the upper green band (potential overbought), with the same ADX and cooldown checks. A red "SELL" arrow shows above the bar.
Alerts pop up with messages, and optional price labels display the close value. It's reversed from typical breakouts (buy low breaks, sell high) to catch reversals at extremes.
Tips for Usage
Best Markets: Great for volatile assets like BTC or stocks on 5-60 min charts—use in trending conditions (blue ADX dots mean go-time).
Customization: Crank up baseMult (to 3+) for wider bands/fewer signals; shorten cooldown (to 5) for more action. Watch the ADX dots at the bottom: White (0-15) = range-bound (avoid trades), orange (15-25) = building trend, blue (>25) = strong move (trust signals).
Trading Strategy: Buy on green arrows in green/yellow backgrounds for pullbacks; sell on red in red/yellow. Always use stops (e.g., below lower band for buys) and combine with RSI (toggle on for overbought/oversold confirmation).
Risk Note: It's not foolproof—test on historical data, and remember, no indicator predicts perfectly. Pair with your own analysis!
릴리즈 노트
update include changing the buy or sell candle blue when triggered릴리즈 노트
Added a settings box for decimal places for trading low priced crypto coins like DOGE for example.릴리즈 노트
Added table for quick viewing of the important metrics릴리즈 노트
Tweaked settings for RSI and ADX it 12 period length instead of tradingviews default 14 for faster signals보호된 스크립트입니다
이 스크립트는 비공개 소스로 게시됩니다. 하지만 제한 없이 자유롭게 사용할 수 있습니다 — 여기에서 자세히 알아보기.
면책사항
이 정보와 게시물은 TradingView에서 제공하거나 보증하는 금융, 투자, 거래 또는 기타 유형의 조언이나 권고 사항을 의미하거나 구성하지 않습니다. 자세한 내용은 이용 약관을 참고하세요.
면책사항
이 정보와 게시물은 TradingView에서 제공하거나 보증하는 금융, 투자, 거래 또는 기타 유형의 조언이나 권고 사항을 의미하거나 구성하지 않습니다. 자세한 내용은 이용 약관을 참고하세요.