OPEN-SOURCE SCRIPT
Simplified STH-MVRV + Z-Score
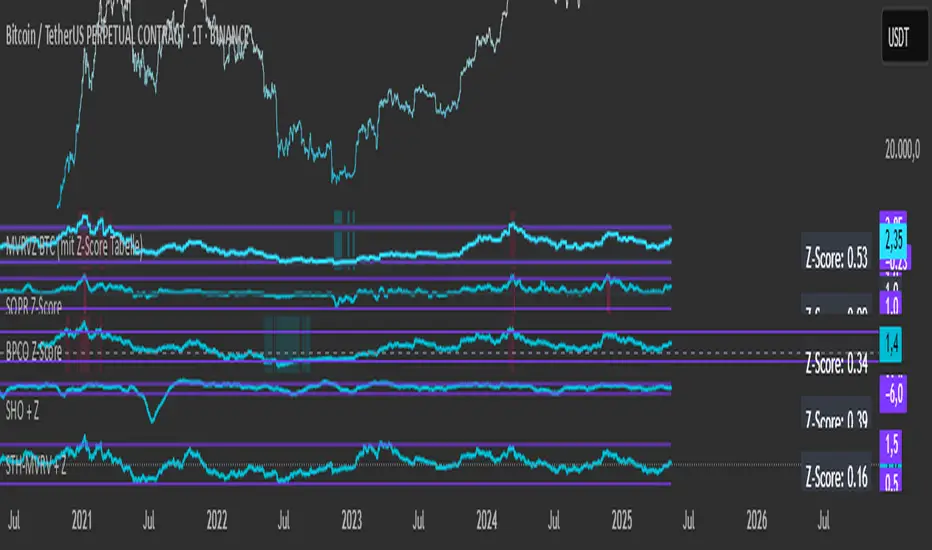
Simplified Short Term Holder MVRV (STH-MVRV) + Z-Score Indicator
Description:
This indicator visualizes the Short Term Holder Market Value to Realized Value ratio (STH-MVRV) and its normalized Z-Score, providing insight into Bitcoin’s market cycle phases and potential overbought or oversold conditions.
How it works:
The STH-MVRV ratio compares the market value of coins held by short-term holders to their realized value, helping to identify periods of profit-taking or accumulation by these holders.
The indicator calculates three versions:
STH-MVRV (MVRV): Ratio of current MVRV to its 155-day SMA.
STH-MVRV (Price): Ratio of BTC price to its 155-day SMA.
STH-MVRV (AVG): Average of the above two ratios.
You can select which ratio to display via the input dropdown.
Threshold Lines:
Adjustable upper and lower threshold lines mark significant levels where market sentiment might shift.
The indicator also plots a baseline at 1.0 as a reference.
Z-Score Explanation:
The Z-Score is a normalized value scaled between -3 and +3, calculated relative to the chosen threshold levels.
When the ratio hits the upper threshold, the Z-Score approaches +2, indicating potential overbought conditions.
Conversely, reaching the lower threshold corresponds to a Z-Score near -2, signaling potential oversold conditions.
This Z-Score is shown in a clear table in the top right corner of the chart for easy monitoring.
Data Sources:
MVRV data is fetched from the BTC_MVRV dataset.
Price data is sourced from the BTC/USD index.
Usage:
Use this indicator to assess short-term holder market behavior and to help identify buying or selling opportunities based on extremes indicated by the Z-Score.
Combining this tool with other analysis can improve timing decisions in Bitcoin trading.
오픈 소스 스크립트
트레이딩뷰의 진정한 정신에 따라, 이 스크립트의 작성자는 이를 오픈소스로 공개하여 트레이더들이 기능을 검토하고 검증할 수 있도록 했습니다. 작성자에게 찬사를 보냅니다! 이 코드는 무료로 사용할 수 있지만, 코드를 재게시하는 경우 하우스 룰이 적용된다는 점을 기억하세요.
면책사항
해당 정보와 게시물은 금융, 투자, 트레이딩 또는 기타 유형의 조언이나 권장 사항으로 간주되지 않으며, 트레이딩뷰에서 제공하거나 보증하는 것이 아닙니다. 자세한 내용은 이용 약관을 참조하세요.
오픈 소스 스크립트
트레이딩뷰의 진정한 정신에 따라, 이 스크립트의 작성자는 이를 오픈소스로 공개하여 트레이더들이 기능을 검토하고 검증할 수 있도록 했습니다. 작성자에게 찬사를 보냅니다! 이 코드는 무료로 사용할 수 있지만, 코드를 재게시하는 경우 하우스 룰이 적용된다는 점을 기억하세요.
면책사항
해당 정보와 게시물은 금융, 투자, 트레이딩 또는 기타 유형의 조언이나 권장 사항으로 간주되지 않으며, 트레이딩뷰에서 제공하거나 보증하는 것이 아닙니다. 자세한 내용은 이용 약관을 참조하세요.