OPEN-SOURCE SCRIPT
Daily ATR Tracker
Daily ATR Tracker
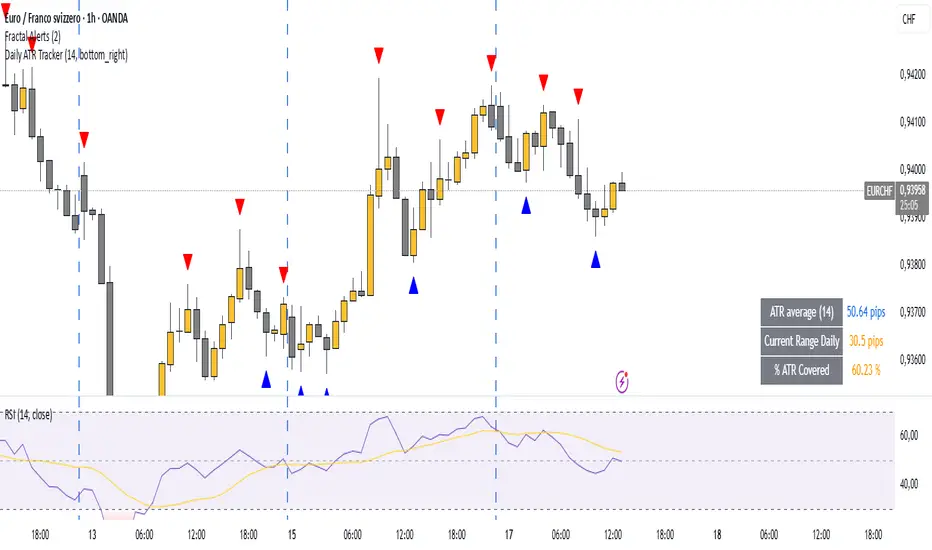
The Daily ATR Tracker is a simple yet powerful tool designed to help traders monitor the daily price movement relative to the average daily range (ATR). This indicator provides an objective view of how much price has moved compared to its recent daily volatility.
🔎 Key Features:
Customizable ATR period (default 14 days)
Live calculation of the current day's price range
ATR value displayed in pips for clear reference
Percentage of ATR covered by the current day's range
Color-coded table for quick visual interpretation:
🟢 Green: less than 60% of ATR covered
🟠 Orange: 60% to 100% of ATR covered
🔴 Red: more than 100% of ATR covered
Alert condition when daily range exceeds 100% of the ATR average
Movable table position to fit your chart layout
🎯 Why use Daily ATR Tracker?
✅ Identify exhaustion zones: When price has already covered a large portion of its typical daily range, the odds of further strong movement may diminish, helping you to manage entries, exits, and risk.
✅ Objective daily bias: Get a quantitative sense of how "stretched" the market is in real time.
✅ Works with any timeframe: While designed for daily ranges, you can monitor intraday movements with this context in mind.
⚠️ Usage Note:
This tool does not provide buy or sell signals by itself. It is designed to complement your existing strategies by offering additional context regarding daily range exhaustion.
오픈 소스 스크립트
트레이딩뷰의 진정한 정신에 따라, 이 스크립트의 작성자는 이를 오픈소스로 공개하여 트레이더들이 기능을 검토하고 검증할 수 있도록 했습니다. 작성자에게 찬사를 보냅니다! 이 코드는 무료로 사용할 수 있지만, 코드를 재게시하는 경우 하우스 룰이 적용된다는 점을 기억하세요.
면책사항
해당 정보와 게시물은 금융, 투자, 트레이딩 또는 기타 유형의 조언이나 권장 사항으로 간주되지 않으며, 트레이딩뷰에서 제공하거나 보증하는 것이 아닙니다. 자세한 내용은 이용 약관을 참조하세요.
오픈 소스 스크립트
트레이딩뷰의 진정한 정신에 따라, 이 스크립트의 작성자는 이를 오픈소스로 공개하여 트레이더들이 기능을 검토하고 검증할 수 있도록 했습니다. 작성자에게 찬사를 보냅니다! 이 코드는 무료로 사용할 수 있지만, 코드를 재게시하는 경우 하우스 룰이 적용된다는 점을 기억하세요.
면책사항
해당 정보와 게시물은 금융, 투자, 트레이딩 또는 기타 유형의 조언이나 권장 사항으로 간주되지 않으며, 트레이딩뷰에서 제공하거나 보증하는 것이 아닙니다. 자세한 내용은 이용 약관을 참조하세요.