OPEN-SOURCE SCRIPT
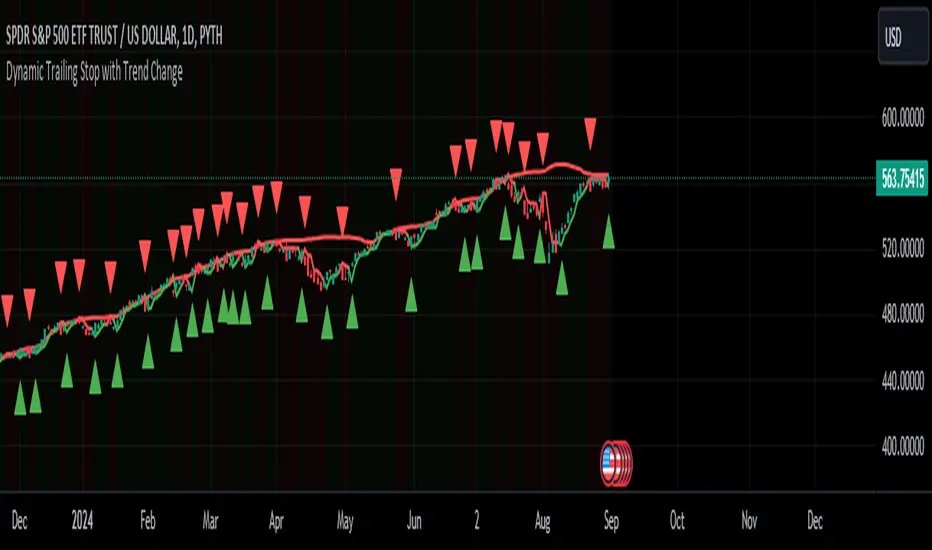
Dynamic Trailing Stop with Trend Change
Key features of this script:
Trend Identification: Uses previous day's high/low breaks to identify trend changes.
Uptrend starts when price closes above the previous day's high.
Downtrend starts when price closes below the previous day's low.
Dynamic Trailing Stop:
In an uptrend, the stop is set to the previous day's low and trails higher.
In a downtrend, the stop is set to the previous day's high and trails lower.
Visual Indicators:
Green triangle for uptrend start, red triangle for downtrend start.
Green/red line for the trailing stop.
Background color changes to light green in uptrends, light red in downtrends.
Alerts:
Trend change alerts when a new trend is identified.
Stop hit alerts when price crosses the trailing stop, suggesting a potential exit.
This implementation allows you to:
Identify trend changes based on previous day's high/low breaks.
Trail your stop loss dynamically as the trend progresses.
Get visual and alert-based signals for trend changes and potential exit points.
For swing trading, you could:
Enter long when an uptrend starts (green triangle).
Set your initial stop loss to the trailing stop (green line).
Exit if the price closes below the trailing stop or a downtrend starts (red triangle).
(Reverse for short trades)
Remember, while this strategy can be effective, it's important to combine it with other forms of analysis and proper risk management. The effectiveness can vary depending on the volatility of the asset and overall market conditions. Always test thoroughly before using in live trading.
오픈 소스 스크립트
트레이딩뷰의 진정한 정신에 따라, 이 스크립트의 작성자는 이를 오픈소스로 공개하여 트레이더들이 기능을 검토하고 검증할 수 있도록 했습니다. 작성자에게 찬사를 보냅니다! 이 코드는 무료로 사용할 수 있지만, 코드를 재게시하는 경우 하우스 룰이 적용된다는 점을 기억하세요.
면책사항
해당 정보와 게시물은 금융, 투자, 트레이딩 또는 기타 유형의 조언이나 권장 사항으로 간주되지 않으며, 트레이딩뷰에서 제공하거나 보증하는 것이 아닙니다. 자세한 내용은 이용 약관을 참조하세요.
오픈 소스 스크립트
트레이딩뷰의 진정한 정신에 따라, 이 스크립트의 작성자는 이를 오픈소스로 공개하여 트레이더들이 기능을 검토하고 검증할 수 있도록 했습니다. 작성자에게 찬사를 보냅니다! 이 코드는 무료로 사용할 수 있지만, 코드를 재게시하는 경우 하우스 룰이 적용된다는 점을 기억하세요.
면책사항
해당 정보와 게시물은 금융, 투자, 트레이딩 또는 기타 유형의 조언이나 권장 사항으로 간주되지 않으며, 트레이딩뷰에서 제공하거나 보증하는 것이 아닙니다. 자세한 내용은 이용 약관을 참조하세요.