OPEN-SOURCE SCRIPT
Wave Channel 3D
Wave Channel 3D
Built by Ricardo idea from JR & Aloakdutt from indieTrades Jan. 2010
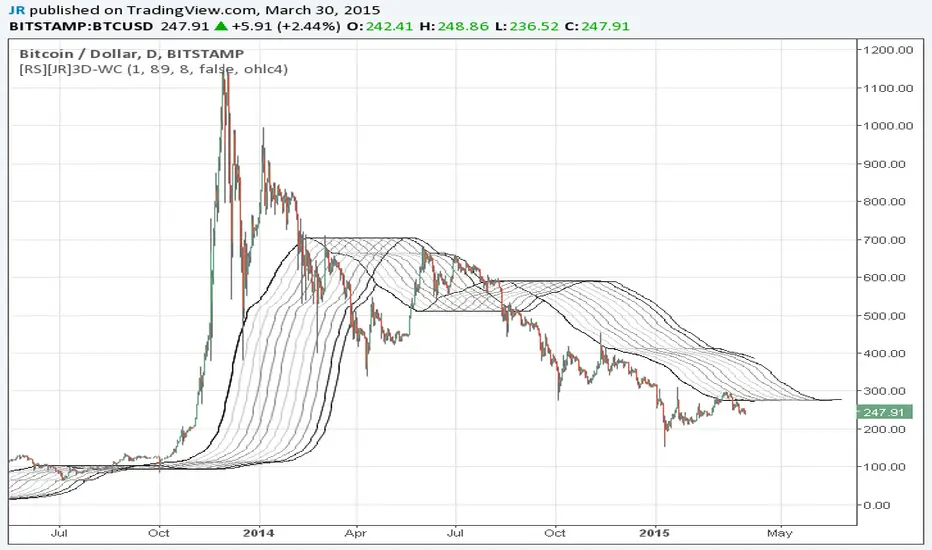
This indicator is very easy to build. We utilize Moving Averages with a set multiplier and an offset. Specially we try to use Fibonacci sequence series numbers (1, 2, 3, 5, 8, 13, 21, 34, 55, 89, 144...) as time space and multiplier (default 89, 8). Also included is Donchian Channel to locate strong trends and possible future support - resistance.
Examples of support/resistance on chart.

Dominant Price Trends

Future Support Resistance

Comparing Fibonacci Series Time Space - Multiplier

When Comparing make note of confluence support/resistance showing up with Fibonacci Series
Example uses DC

When Comparing make note of confluence support/resistance showing up with Fibonacci Series
Example without DC / Smooth MA

Built by Ricardo idea from JR & Aloakdutt from indieTrades Jan. 2010
This indicator is very easy to build. We utilize Moving Averages with a set multiplier and an offset. Specially we try to use Fibonacci sequence series numbers (1, 2, 3, 5, 8, 13, 21, 34, 55, 89, 144...) as time space and multiplier (default 89, 8). Also included is Donchian Channel to locate strong trends and possible future support - resistance.
Examples of support/resistance on chart.
Dominant Price Trends
Future Support Resistance
Comparing Fibonacci Series Time Space - Multiplier
When Comparing make note of confluence support/resistance showing up with Fibonacci Series
Example uses DC
When Comparing make note of confluence support/resistance showing up with Fibonacci Series
Example without DC / Smooth MA
오픈 소스 스크립트
트레이딩뷰의 진정한 정신에 따라, 이 스크립트의 작성자는 이를 오픈소스로 공개하여 트레이더들이 기능을 검토하고 검증할 수 있도록 했습니다. 작성자에게 찬사를 보냅니다! 이 코드는 무료로 사용할 수 있지만, 코드를 재게시하는 경우 하우스 룰이 적용된다는 점을 기억하세요.
면책사항
해당 정보와 게시물은 금융, 투자, 트레이딩 또는 기타 유형의 조언이나 권장 사항으로 간주되지 않으며, 트레이딩뷰에서 제공하거나 보증하는 것이 아닙니다. 자세한 내용은 이용 약관을 참조하세요.
오픈 소스 스크립트
트레이딩뷰의 진정한 정신에 따라, 이 스크립트의 작성자는 이를 오픈소스로 공개하여 트레이더들이 기능을 검토하고 검증할 수 있도록 했습니다. 작성자에게 찬사를 보냅니다! 이 코드는 무료로 사용할 수 있지만, 코드를 재게시하는 경우 하우스 룰이 적용된다는 점을 기억하세요.
면책사항
해당 정보와 게시물은 금융, 투자, 트레이딩 또는 기타 유형의 조언이나 권장 사항으로 간주되지 않으며, 트레이딩뷰에서 제공하거나 보증하는 것이 아닙니다. 자세한 내용은 이용 약관을 참조하세요.