OPEN-SOURCE SCRIPT
Combined SMA with Murrey Math and Fixed Fractal Bands
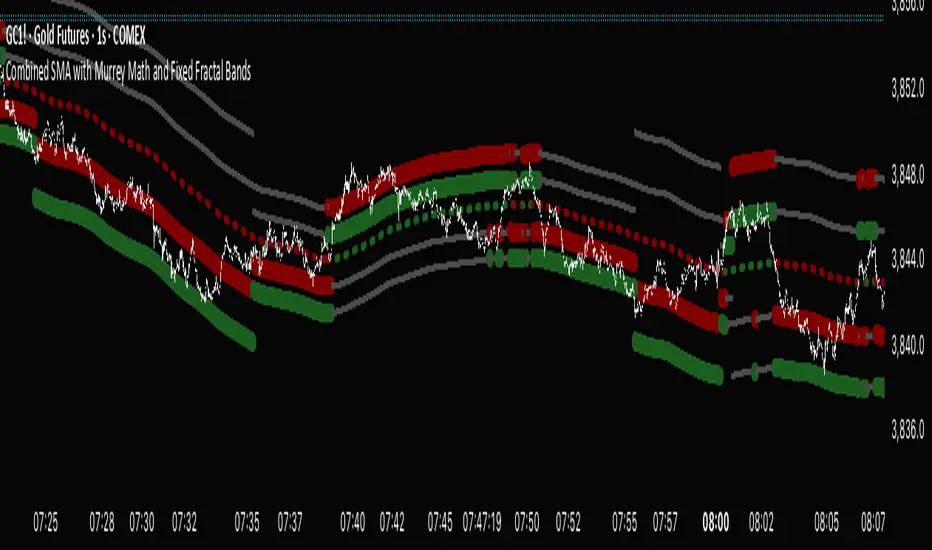
"Combined SMA with Murrey Math and Fixed Fractal Bands" , overlaying a Simple Moving Average (SMA), Murrey Math (MM) bands, and fixed fractal bands on a price chart. Here's a brief description of its functionality:Inputs:SMA Length: Configurable period for the SMA (default: 180 bars).
Resolution: Optional custom timeframe for data.
Frame Size for MM: Lookback period for Murrey Math calculations (default: 180 bars, adjustable via multiplier).
Ignore Wicks: Option to use open/close prices instead of high/low for MM calculations.
Fixed Fractal Size: Fixed distance in points for fractal bands (default: 1.22).
Shade 3/8-5/8 Overlap: Option to highlight overlapping regions between SMA-centered and absolute MM bands.
Data Source:Uses open, close, high, and low prices from the specified ticker and timeframe.
Optionally ignores wicks (high/low) for MM calculations, using max/min of open/close instead.
SMA Calculation:Computes a Simple Moving Average (SMA) based on the closing price and user-defined length.
Murrey Math Bands:Absolute MM Bands: Calculated using a dynamic range based on the highest/lowest prices over a lookback period, scaled logarithmically to create 13 levels (from -3/8 to +3/8, with 8/8 as the midpoint). These adapt to price action.
SMA-Centered MM Bands: Constructs MM bands relative to the SMA, with levels (0/8 to 8/8) spaced by a calculated increment derived from the absolute MM range.
Colors bands dynamically (green for bullish, red for bearish, gray for neutral) based on changes in the 4/8 level or increment, with labels indicating "Higher," "Lower," or "Same" states.
Fixed Fractal Bands:Plots six fixed-distance bands (±1, ±2, ±3) around the SMA, using a user-defined point value (default: 1.22).
Overlaps and Shading:Detects overlaps between SMA-centered and absolute MM bands at key levels (7/8-8/8, 0/8-1/8, and optionally 3/8-5/8).
Shades overlapping regions with distinct colors (red for 7/8-8/8, green for 0/8-1/8, blue for 3/8-5/8).
Fills specific SMA-centered MM regions (3/8-5/8, 0/8-1/8, 7/8-8/8) for visual emphasis.
Visualization:Plots SMA-centered MM bands, absolute MM bands, and fixed fractal bands as stepped lines with varying colors and transparency.
Displays a table at the bottom-right showing the current MM increment value.
Adds labels when the 4/8 level or increment changes, indicating trend direction.
In summary, this indicator combines a user-defined SMA with Murrey Math bands (both absolute and SMA-centered) and fixed fractal bands to provide a multi-level support/resistance framework. It highlights dynamic price levels, trend direction, and key overlaps, aiding traders in identifying potential reversal or consolidation zones.
오픈 소스 스크립트
트레이딩뷰의 진정한 정신에 따라, 이 스크립트의 작성자는 이를 오픈소스로 공개하여 트레이더들이 기능을 검토하고 검증할 수 있도록 했습니다. 작성자에게 찬사를 보냅니다! 이 코드는 무료로 사용할 수 있지만, 코드를 재게시하는 경우 하우스 룰이 적용된다는 점을 기억하세요.
면책사항
해당 정보와 게시물은 금융, 투자, 트레이딩 또는 기타 유형의 조언이나 권장 사항으로 간주되지 않으며, 트레이딩뷰에서 제공하거나 보증하는 것이 아닙니다. 자세한 내용은 이용 약관을 참조하세요.
오픈 소스 스크립트
트레이딩뷰의 진정한 정신에 따라, 이 스크립트의 작성자는 이를 오픈소스로 공개하여 트레이더들이 기능을 검토하고 검증할 수 있도록 했습니다. 작성자에게 찬사를 보냅니다! 이 코드는 무료로 사용할 수 있지만, 코드를 재게시하는 경우 하우스 룰이 적용된다는 점을 기억하세요.
면책사항
해당 정보와 게시물은 금융, 투자, 트레이딩 또는 기타 유형의 조언이나 권장 사항으로 간주되지 않으며, 트레이딩뷰에서 제공하거나 보증하는 것이 아닙니다. 자세한 내용은 이용 약관을 참조하세요.