INVITE-ONLY SCRIPT
Seasonality
📈 What “Seasonality” Means in Trading
Seasonality in trading refers to recurring market patterns that tend to happen around the same time each year, month, or even week. These patterns are based on historical tendencies, for example, certain stocks or indices often rise or fall during specific periods due to consistent economic, institutional, or behavioral factors.
A simple example:
The S&P 500 often performs stronger in the last quarter of the year (“Santa Rally”).
Crude oil prices tend to rise during summer months when demand for fuel increases.
Agricultural commodities follow planting and harvest cycles.
By analyzing these seasonal trends, traders can gain an additional layer of probability in their decision-making. It doesn’t replace technical or fundamental analysis, but it complements them by showing when a market historically tends to move in a certain direction.
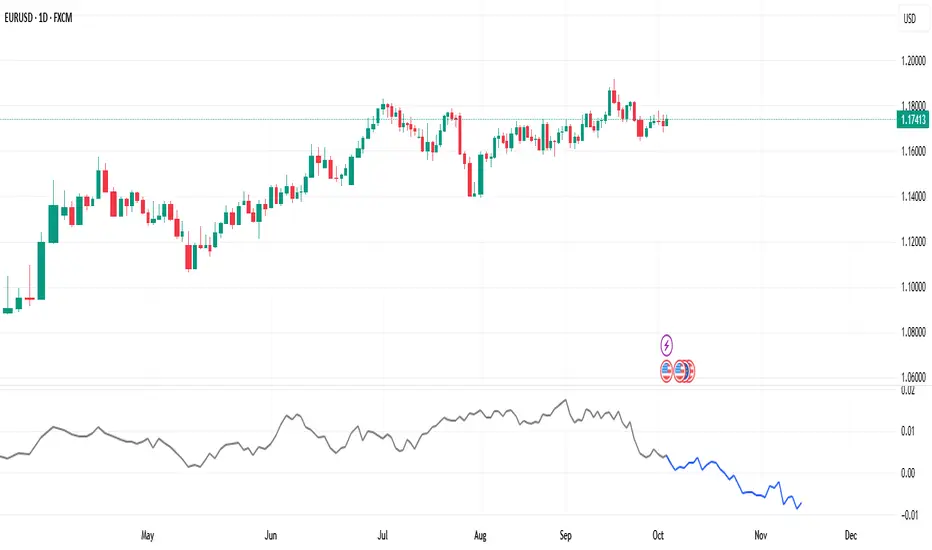
That’s why a seasonality indicator can be extremely useful:
It visualizes past performance patterns directly on your chart.
It helps identify periods of high or low probability for bullish or bearish moves.
It allows traders to align trades with statistical tendencies, not just current price action.
You can also customize the lookback period, for example, view seasonal patterns from the last 5, 10, 15, or 20 years, depending on how much historical data you want to include.
In short, a good seasonality indicator doesn’t predict the future, it highlights what markets tend to do, helping traders act with more context and confidence.
Seasonality in trading refers to recurring market patterns that tend to happen around the same time each year, month, or even week. These patterns are based on historical tendencies, for example, certain stocks or indices often rise or fall during specific periods due to consistent economic, institutional, or behavioral factors.
A simple example:
The S&P 500 often performs stronger in the last quarter of the year (“Santa Rally”).
Crude oil prices tend to rise during summer months when demand for fuel increases.
Agricultural commodities follow planting and harvest cycles.
By analyzing these seasonal trends, traders can gain an additional layer of probability in their decision-making. It doesn’t replace technical or fundamental analysis, but it complements them by showing when a market historically tends to move in a certain direction.
That’s why a seasonality indicator can be extremely useful:
It visualizes past performance patterns directly on your chart.
It helps identify periods of high or low probability for bullish or bearish moves.
It allows traders to align trades with statistical tendencies, not just current price action.
You can also customize the lookback period, for example, view seasonal patterns from the last 5, 10, 15, or 20 years, depending on how much historical data you want to include.
In short, a good seasonality indicator doesn’t predict the future, it highlights what markets tend to do, helping traders act with more context and confidence.
초대 전용 스크립트
이 스크립트는 작성자가 승인한 사용자만 접근할 수 있습니다. 사용하려면 요청을 보내고 승인을 받아야 합니다. 일반적으로 결제 후에 승인이 이루어집니다. 자세한 내용은 아래 작성자의 지침을 따르거나 SDprof에게 직접 문의하세요.
트레이딩뷰는 스크립트 작성자를 완전히 신뢰하고 스크립트 작동 방식을 이해하지 않는 한 스크립트 비용을 지불하거나 사용하지 않는 것을 권장하지 않습니다. 무료 오픈소스 대체 스크립트는 커뮤니티 스크립트에서 찾을 수 있습니다.
작성자 지시 사항
If You want an access, write me there in TV
면책사항
이 정보와 게시물은 TradingView에서 제공하거나 보증하는 금융, 투자, 거래 또는 기타 유형의 조언이나 권고 사항을 의미하거나 구성하지 않습니다. 자세한 내용은 이용 약관을 참고하세요.