OPEN-SOURCE SCRIPT
Inside Bar with Swing Points
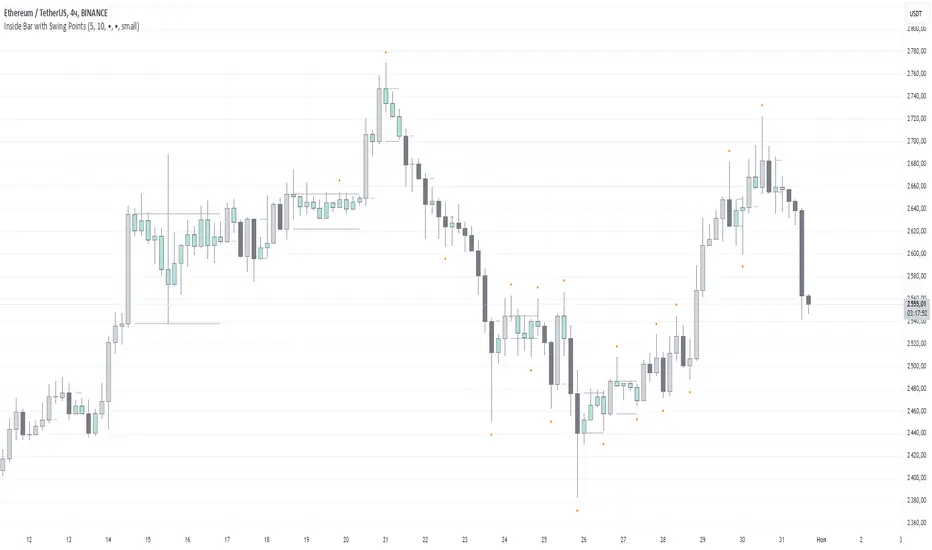
Swing Points with Inside Bar [EK]
This script combines swing point analysis with an inside bar pattern visualization, merging essential concepts to identify and visualize key price levels and potential trend reversals. This is especially useful for traders looking to understand price action through swing levels and reactions within inside bar boundaries, making it effective for short-term trend analysis and reversal zone identification.
Script Features:
Swing Point Analysis:

The script identifies swing points based on fractals with a configurable number of bars, allowing for a choice between three and five bars, helping traders fine-tune sensitivity to price movements.
Swing points are visualized as labels, highlighting potential reversal or continuation zones in the price chart.
Inside Bar Visualization:

Inside bars are defined as bars where both the high and low are contained within the previous bar. These often signal consolidation before a potential breakout.
The script displays boundaries of the mother bar (the initial bar encompassing inside bars) and colors candles accordingly, highlighting those within these boundaries.
This feature helps traders focus on price areas where a breakout or trend shift may occur.
Utility and Application:
The script enables traders to visualize inside bars and swing points, which is particularly useful for short-term traders focused on reversal or trend continuation strategies.
Combining swing point analysis with inside bar identification offers a unique approach, helping traders locate key consolidation zones that may precede significant price moves.
This provides not only strong support and resistance levels but also insights into probable breakout points.
How to Use the Script:
Set the number of bars for swing point analysis (3 or 5) to adjust fractal sensitivity.
Enable mother bar boundary visualization and color indication for inside bars to easily spot consolidation patterns.
Pay attention to areas with multiple swing points and inside bars, as these often signal potential reversal or breakout zones.
This script offers flexible tools for analyzing price movements through both swing analysis and consolidation zone identification, aiding decision-making under uncertainty and enhancing market structure understanding.
This script combines swing point analysis with an inside bar pattern visualization, merging essential concepts to identify and visualize key price levels and potential trend reversals. This is especially useful for traders looking to understand price action through swing levels and reactions within inside bar boundaries, making it effective for short-term trend analysis and reversal zone identification.
Script Features:
Swing Point Analysis:
The script identifies swing points based on fractals with a configurable number of bars, allowing for a choice between three and five bars, helping traders fine-tune sensitivity to price movements.
Swing points are visualized as labels, highlighting potential reversal or continuation zones in the price chart.
Inside Bar Visualization:
Inside bars are defined as bars where both the high and low are contained within the previous bar. These often signal consolidation before a potential breakout.
The script displays boundaries of the mother bar (the initial bar encompassing inside bars) and colors candles accordingly, highlighting those within these boundaries.
This feature helps traders focus on price areas where a breakout or trend shift may occur.
Utility and Application:
The script enables traders to visualize inside bars and swing points, which is particularly useful for short-term traders focused on reversal or trend continuation strategies.
Combining swing point analysis with inside bar identification offers a unique approach, helping traders locate key consolidation zones that may precede significant price moves.
This provides not only strong support and resistance levels but also insights into probable breakout points.
How to Use the Script:
Set the number of bars for swing point analysis (3 or 5) to adjust fractal sensitivity.
Enable mother bar boundary visualization and color indication for inside bars to easily spot consolidation patterns.
Pay attention to areas with multiple swing points and inside bars, as these often signal potential reversal or breakout zones.
This script offers flexible tools for analyzing price movements through both swing analysis and consolidation zone identification, aiding decision-making under uncertainty and enhancing market structure understanding.
오픈 소스 스크립트
트레이딩뷰의 진정한 정신에 따라, 이 스크립트의 작성자는 이를 오픈소스로 공개하여 트레이더들이 기능을 검토하고 검증할 수 있도록 했습니다. 작성자에게 찬사를 보냅니다! 이 코드는 무료로 사용할 수 있지만, 코드를 재게시하는 경우 하우스 룰이 적용된다는 점을 기억하세요.
면책사항
해당 정보와 게시물은 금융, 투자, 트레이딩 또는 기타 유형의 조언이나 권장 사항으로 간주되지 않으며, 트레이딩뷰에서 제공하거나 보증하는 것이 아닙니다. 자세한 내용은 이용 약관을 참조하세요.
오픈 소스 스크립트
트레이딩뷰의 진정한 정신에 따라, 이 스크립트의 작성자는 이를 오픈소스로 공개하여 트레이더들이 기능을 검토하고 검증할 수 있도록 했습니다. 작성자에게 찬사를 보냅니다! 이 코드는 무료로 사용할 수 있지만, 코드를 재게시하는 경우 하우스 룰이 적용된다는 점을 기억하세요.
면책사항
해당 정보와 게시물은 금융, 투자, 트레이딩 또는 기타 유형의 조언이나 권장 사항으로 간주되지 않으며, 트레이딩뷰에서 제공하거나 보증하는 것이 아닙니다. 자세한 내용은 이용 약관을 참조하세요.