OPEN-SOURCE SCRIPT
3M-10Y Yield Spread
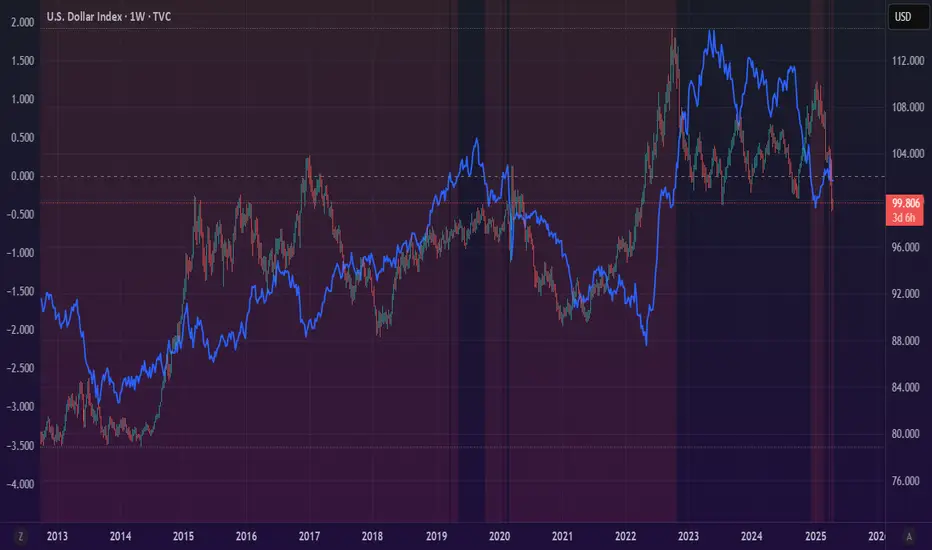
3M-10Y Yield Spread Indicator Description
What It Is:
This indicator calculates the difference (spread) between the 3-month and 10-year US Treasury yields, plotted as a line with a zero reference. The background turns red when the spread inverts (falls below zero), signaling when the 3-month yield exceeds the 10-year yield.
What It Helps Understand:
Economic Health: An inverted yield curve (spread < 0) often predicts recessions, as it reflects market expectations of future economic slowdown, typically preceding downturns by 6-18 months.
Fed Policy Impact: Fed rate hikes can push short-term yields (like the 3-month) higher, potentially causing inversion if long-term yields (10-year) don’t rise as much due to growth concerns. Conversely, Fed rate cuts can lower short-term yields, steepening the curve (spread > 0), signaling economic stimulus or recovery expectations.
오픈 소스 스크립트
트레이딩뷰의 진정한 정신에 따라, 이 스크립트의 작성자는 이를 오픈소스로 공개하여 트레이더들이 기능을 검토하고 검증할 수 있도록 했습니다. 작성자에게 찬사를 보냅니다! 이 코드는 무료로 사용할 수 있지만, 코드를 재게시하는 경우 하우스 룰이 적용된다는 점을 기억하세요.
면책사항
해당 정보와 게시물은 금융, 투자, 트레이딩 또는 기타 유형의 조언이나 권장 사항으로 간주되지 않으며, 트레이딩뷰에서 제공하거나 보증하는 것이 아닙니다. 자세한 내용은 이용 약관을 참조하세요.
오픈 소스 스크립트
트레이딩뷰의 진정한 정신에 따라, 이 스크립트의 작성자는 이를 오픈소스로 공개하여 트레이더들이 기능을 검토하고 검증할 수 있도록 했습니다. 작성자에게 찬사를 보냅니다! 이 코드는 무료로 사용할 수 있지만, 코드를 재게시하는 경우 하우스 룰이 적용된다는 점을 기억하세요.
면책사항
해당 정보와 게시물은 금융, 투자, 트레이딩 또는 기타 유형의 조언이나 권장 사항으로 간주되지 않으며, 트레이딩뷰에서 제공하거나 보증하는 것이 아닙니다. 자세한 내용은 이용 약관을 참조하세요.