PROTECTED SOURCE SCRIPT
업데이트됨 Price/Moving Average
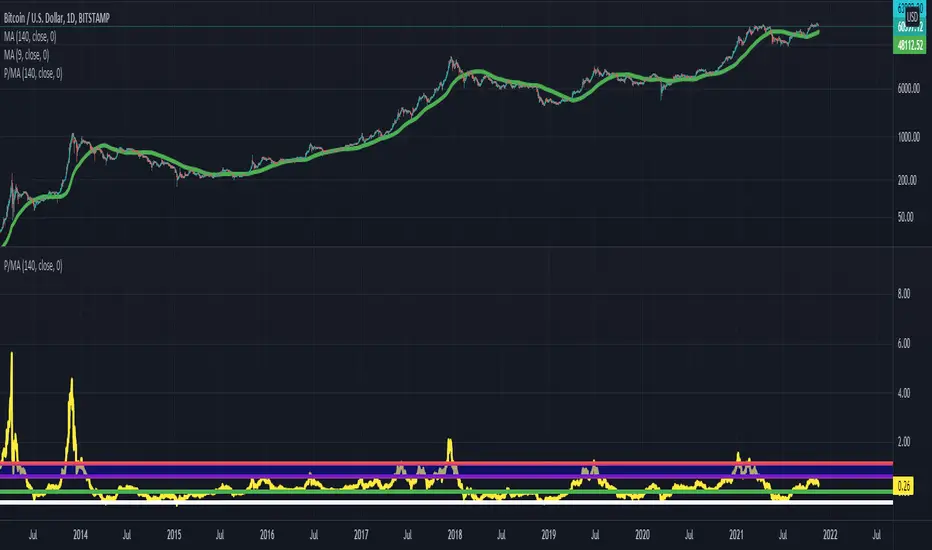
Price / Moving average indicator.
Support and resistance levels are established for Bitcoin.
When in a bear market, -50% below the 20 week MA acts as support.
When in a bull market, between 60% to 100% above the 20 week MA acts as resistance. Historically, these levels once hit, send Bitcoin back down to it's 20 week moving average.
In the setting of a bear market, historically, we do not ever get up to the 60% above the 20 week MA level.
Please note, this is only based on historical trends, and is not guaranteed to remain true in this or future market cycles.
릴리즈 노트
Remember, these values for support and resistance are not exact, in reality they vary by about 5-10% per cycle historically.보호된 스크립트입니다
이 스크립트는 비공개 소스로 게시됩니다. 하지만 이를 자유롭게 제한 없이 사용할 수 있습니다 – 자세한 내용은 여기에서 확인하세요.
면책사항
해당 정보와 게시물은 금융, 투자, 트레이딩 또는 기타 유형의 조언이나 권장 사항으로 간주되지 않으며, 트레이딩뷰에서 제공하거나 보증하는 것이 아닙니다. 자세한 내용은 이용 약관을 참조하세요.
면책사항
해당 정보와 게시물은 금융, 투자, 트레이딩 또는 기타 유형의 조언이나 권장 사항으로 간주되지 않으며, 트레이딩뷰에서 제공하거나 보증하는 것이 아닙니다. 자세한 내용은 이용 약관을 참조하세요.