OPEN-SOURCE SCRIPT
업데이트됨 Levels
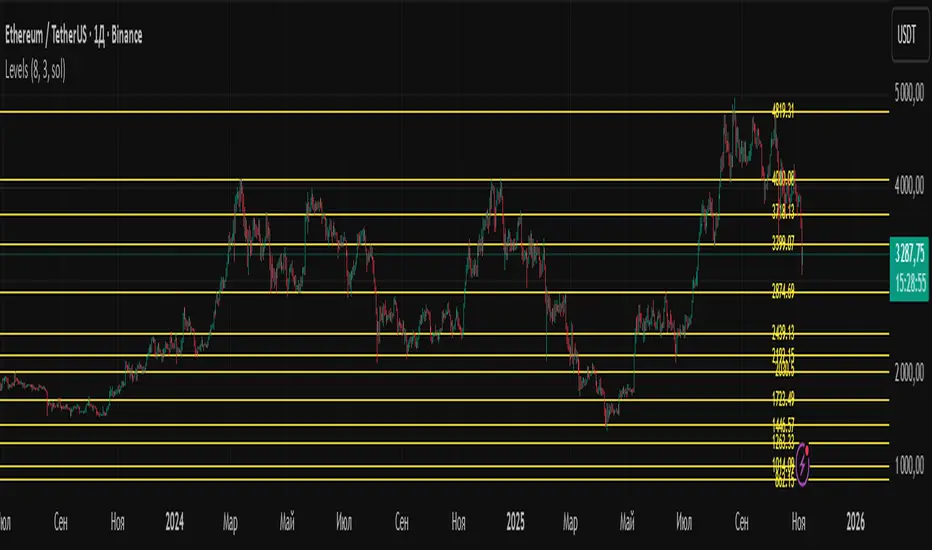
Levels is a powerful technical analysis tool that automatically identifies and displays key support and resistance levels on the chart. The indicator analyzes historical price data, detecting significant price levels where multiple reversals or price stops have occurred.
How the Indicator Works?
1. Identification of Reversal Points:
- The indicator tracks price extremes using an algorithm to identify local highs and lows
- A reversal point is recorded when:
- Uptrend: price reaches a new low for the last 10 bars
- Downtrend: price reaches a new high for the last 10 bars
2. Level Grouping:
- All found reversal points are analyzed and grouped into key levels
- Levels are combined if they fall within the specified percentage tolerance
3. Filtering Significant Levels:
- Only levels that have been tested the minimum number of times (set in settings) are preserved
- This ensures only statistically significant levels are displayed
How to Use the Indicator?
Trading Scenarios:
1. Bounce from Level:
- When price approaches an identified level, a bounce can be expected
- Opening positions on the bounce with protective stop-loss beyond the level
2. Level Breakout:
- Breaking through a key level may signal trend continuation
- Support level becomes resistance and vice versa
3. Consolidation near Level:
- Prolonged price presence near a level indicates its significance
- Strong movement can be expected after exiting consolidation
Advantages:
- Automatic level identification eliminates subjectivity
- Sensitivity customization for different timeframes and instruments
- Visual simplicity - only significant levels
Indicator Settings
Main Parameters:
- Show Key Levels - enable/disable level display
- Level Tolerance (%) - percentage tolerance for level grouping
- Smaller values: more levels, more precise
- Larger values: fewer levels, more significant
- Minimum Touches - minimum number of touches to form a level
Visual Settings:
- Level Color - level display color
- Level Style - line style (solid, dashed, dotted)
Limitations
- Levels are built only on available historical data
- Does not account for trading volumes
- Parameter adjustment may be required during high volatility periods
The indicator is particularly effective when combined with other analysis tools for signal confirmation.
릴리즈 노트
new levels오픈 소스 스크립트
트레이딩뷰의 진정한 정신에 따라, 이 스크립트의 작성자는 이를 오픈소스로 공개하여 트레이더들이 기능을 검토하고 검증할 수 있도록 했습니다. 작성자에게 찬사를 보냅니다! 이 코드는 무료로 사용할 수 있지만, 코드를 재게시하는 경우 하우스 룰이 적용된다는 점을 기억하세요.
💡 Обсуждаем торговые идеи , делимся индикаторами и стратегиями в нашем Telegram-чате:
👉 t.me/+AQWwxRhhrXI0YTgy
👉 t.me/+AQWwxRhhrXI0YTgy
면책사항
해당 정보와 게시물은 금융, 투자, 트레이딩 또는 기타 유형의 조언이나 권장 사항으로 간주되지 않으며, 트레이딩뷰에서 제공하거나 보증하는 것이 아닙니다. 자세한 내용은 이용 약관을 참조하세요.
오픈 소스 스크립트
트레이딩뷰의 진정한 정신에 따라, 이 스크립트의 작성자는 이를 오픈소스로 공개하여 트레이더들이 기능을 검토하고 검증할 수 있도록 했습니다. 작성자에게 찬사를 보냅니다! 이 코드는 무료로 사용할 수 있지만, 코드를 재게시하는 경우 하우스 룰이 적용된다는 점을 기억하세요.
💡 Обсуждаем торговые идеи , делимся индикаторами и стратегиями в нашем Telegram-чате:
👉 t.me/+AQWwxRhhrXI0YTgy
👉 t.me/+AQWwxRhhrXI0YTgy
면책사항
해당 정보와 게시물은 금융, 투자, 트레이딩 또는 기타 유형의 조언이나 권장 사항으로 간주되지 않으며, 트레이딩뷰에서 제공하거나 보증하는 것이 아닙니다. 자세한 내용은 이용 약관을 참조하세요.