PROTECTED SOURCE SCRIPT
[MattLet] RSI Andrew Cardwell
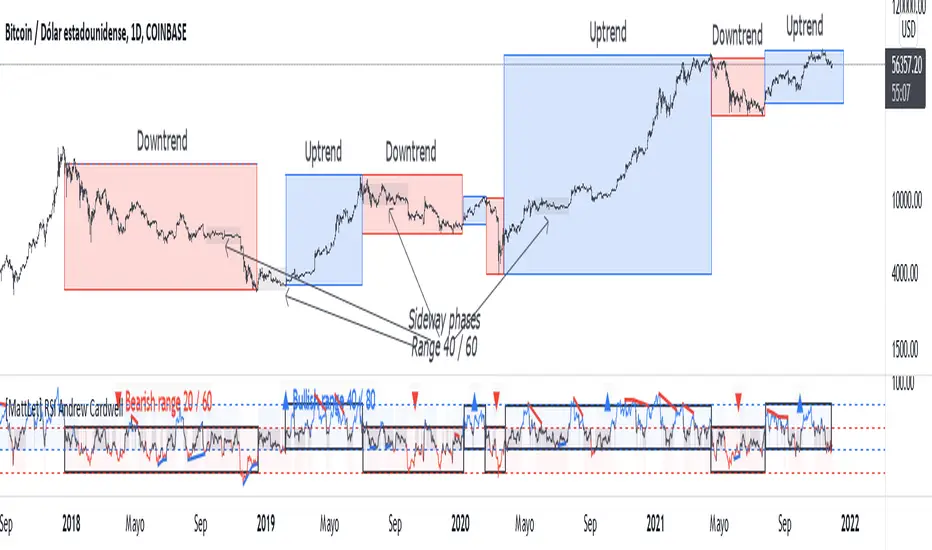
Andrew Cardwell RSI helps to identify the range shift, which states whether the market is in bullish or bearish phase.
When RSI oscillates in the range of 40 to 80 we can said that we are in a uptrend (blue background color on RSI), however when RSI oscillates in the range of 20 to 60 we are in a downtrend (red background color on RSI).
Finally if the RSI oscillates between 40 to 60, it is considerated a sideway phase (gray background color on RSI).
Keep in mind that within an uptrend or downtrend there may be a lateral phases and then continue in the trend (gray boxes on the BTC/USD price xample)
I added bearish and bullish divergences (hidden divergences too) to help users to indentify possible trending endings.
Note: I still working improving how the indicator display the areas, so I will letting you know when I finish that. Anyway, you can use it normally right now.
Good Luck!
보호된 스크립트입니다
이 스크립트는 비공개 소스로 게시됩니다. 하지만 이를 자유롭게 제한 없이 사용할 수 있습니다 – 자세한 내용은 여기에서 확인하세요.
면책사항
해당 정보와 게시물은 금융, 투자, 트레이딩 또는 기타 유형의 조언이나 권장 사항으로 간주되지 않으며, 트레이딩뷰에서 제공하거나 보증하는 것이 아닙니다. 자세한 내용은 이용 약관을 참조하세요.
보호된 스크립트입니다
이 스크립트는 비공개 소스로 게시됩니다. 하지만 이를 자유롭게 제한 없이 사용할 수 있습니다 – 자세한 내용은 여기에서 확인하세요.
면책사항
해당 정보와 게시물은 금융, 투자, 트레이딩 또는 기타 유형의 조언이나 권장 사항으로 간주되지 않으며, 트레이딩뷰에서 제공하거나 보증하는 것이 아닙니다. 자세한 내용은 이용 약관을 참조하세요.