OPEN-SOURCE SCRIPT
Nadaraya-Watson Envelope: Modified by Yosiet
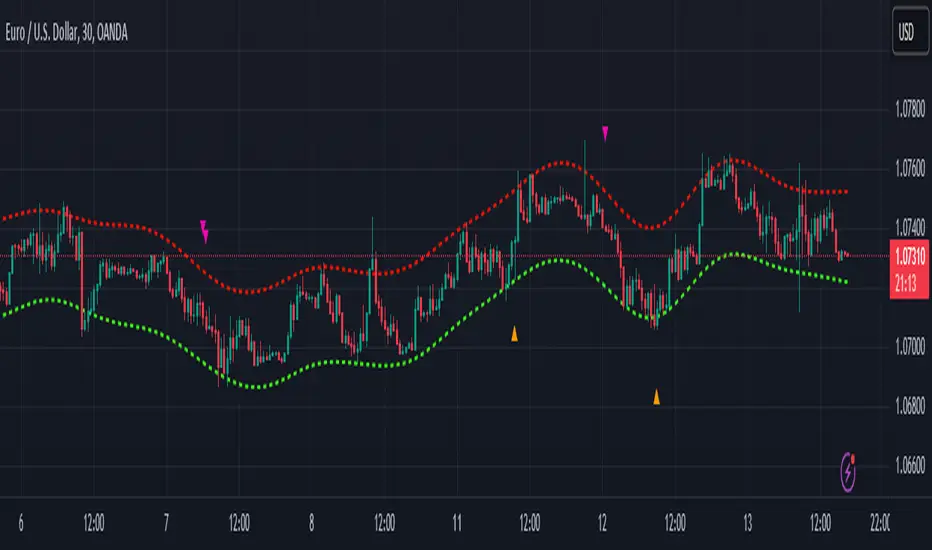
Range Filter indicator based on the LuxAlgo Nadaraya-Watson Envelope (tradingview.com/v/Iko0E2kL/) indicator adding the SMA 30 high and SMA 7 low to predict the changes of the trends lines price.
WARNING: This indicator, as the same as the original, repaints the chart and could affect the exact values of the prices.
SMA Low 7 was identified using tensorflowJS years ago as accurate and abstract rsi indicator
SMA High 30 was identified using tensorflowJS years ago as accurate and strong trend line
This two SMAs were added to the original indicator Nadaraya-Watson to predict the exact points where the price will change direction or will re-test the trend to continue on.
The signals will act as the Williams Fractals, replacing the original signals of the indicator.
For those ICT/SMC traders, the bands and SMAs can toggle off in the settings of this indicator.
SETTINGS
ALERTS AND SIGNALS
HOW TO USE IT
DISCLAIMER: This indicator or script does not imply or constitute financial advice, investment advice, trading advice or any other type of advice or recommendation by and for TradingView. Use it at your own risk and your own decision.
WARNING: This indicator, as the same as the original, repaints the chart and could affect the exact values of the prices.
SMA Low 7 was identified using tensorflowJS years ago as accurate and abstract rsi indicator
SMA High 30 was identified using tensorflowJS years ago as accurate and strong trend line
This two SMAs were added to the original indicator Nadaraya-Watson to predict the exact points where the price will change direction or will re-test the trend to continue on.
The signals will act as the Williams Fractals, replacing the original signals of the indicator.
For those ICT/SMC traders, the bands and SMAs can toggle off in the settings of this indicator.
SETTINGS
- Can set the source of the UPPER band indivuadilly
- Can set the source of the LOWER band indivuadilly
- Can toggle the visibility of the bands, this will not affect the calculations
- Can toggle the visibility of SMAs
ALERTS AND SIGNALS
- When the SMA LOW 7 cross under or over the bands, will trigger a signal orange
- When the SMA 30 High cross over the upper band, will trigger a short signal purpple
HOW TO USE IT
- If the both signals appears (sma 7 low and sma 30 high) crossing the upper band at the same point, this means that the price will drop strongly.
- If the sma 7 low cross signal (orange triangle) appears under the price and lower band, means that the price will go up.
- The separation of the signals from the chart will suggest the force of the movement. While more distance be, strongest reaction of the price.
DISCLAIMER: This indicator or script does not imply or constitute financial advice, investment advice, trading advice or any other type of advice or recommendation by and for TradingView. Use it at your own risk and your own decision.
오픈 소스 스크립트
트레이딩뷰의 진정한 정신에 따라, 이 스크립트의 작성자는 이를 오픈소스로 공개하여 트레이더들이 기능을 검토하고 검증할 수 있도록 했습니다. 작성자에게 찬사를 보냅니다! 이 코드는 무료로 사용할 수 있지만, 코드를 재게시하는 경우 하우스 룰이 적용된다는 점을 기억하세요.
면책사항
해당 정보와 게시물은 금융, 투자, 트레이딩 또는 기타 유형의 조언이나 권장 사항으로 간주되지 않으며, 트레이딩뷰에서 제공하거나 보증하는 것이 아닙니다. 자세한 내용은 이용 약관을 참조하세요.
오픈 소스 스크립트
트레이딩뷰의 진정한 정신에 따라, 이 스크립트의 작성자는 이를 오픈소스로 공개하여 트레이더들이 기능을 검토하고 검증할 수 있도록 했습니다. 작성자에게 찬사를 보냅니다! 이 코드는 무료로 사용할 수 있지만, 코드를 재게시하는 경우 하우스 룰이 적용된다는 점을 기억하세요.
면책사항
해당 정보와 게시물은 금융, 투자, 트레이딩 또는 기타 유형의 조언이나 권장 사항으로 간주되지 않으며, 트레이딩뷰에서 제공하거나 보증하는 것이 아닙니다. 자세한 내용은 이용 약관을 참조하세요.