OPEN-SOURCE SCRIPT
업데이트됨 (mab) ATR Band
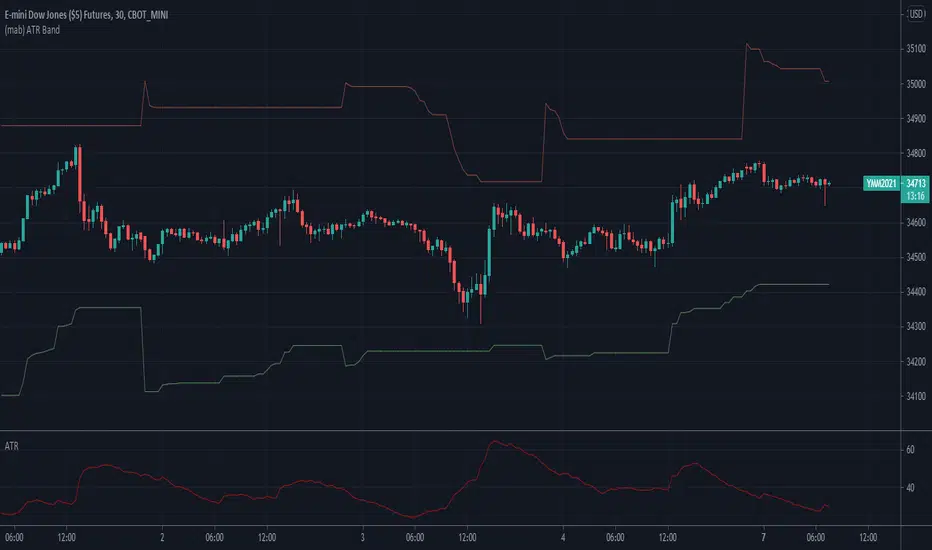
Simple ATR band as overlay on price chart.
릴리즈 노트
This updated version is more advanced. It plots a simple ATR band on daily and higher time frames. On intraday charts it can plot a dynamic band that takes the previous days ATR as starting point. At new lows it lowers the upper band to the new low plus the previous days ATR. At new highs it rises the lower band to the new high minus the previous days ATR.릴리즈 노트
This update enhances the (mab) ATR Band indicator with multi time frame capabilities. If "Floating daily ATR on intraday charts" is enabled, it shows the previous days ATR value as a starting point at the start of the session on intraday charts. At new lows it lowers the upper band to the new low plus the previous days ATR. At new highs it rises the lower band to the new high minus the previous days ATR.Similarly if "Floating weekly/monthly ATR on daily/weekly charts" is enabled, it shows the previous weeks ATR as starting point on daily charts and the previous months ATR on weekly charts. At new lows it lowers the upper band to the new low plus the previous weeks/moths ATR. At new highs it rises the lower band to the new high minus the previous weeks/months ATR.
오픈 소스 스크립트
트레이딩뷰의 진정한 정신에 따라, 이 스크립트의 작성자는 이를 오픈소스로 공개하여 트레이더들이 기능을 검토하고 검증할 수 있도록 했습니다. 작성자에게 찬사를 보냅니다! 이 코드는 무료로 사용할 수 있지만, 코드를 재게시하는 경우 하우스 룰이 적용된다는 점을 기억하세요.
면책사항
해당 정보와 게시물은 금융, 투자, 트레이딩 또는 기타 유형의 조언이나 권장 사항으로 간주되지 않으며, 트레이딩뷰에서 제공하거나 보증하는 것이 아닙니다. 자세한 내용은 이용 약관을 참조하세요.
오픈 소스 스크립트
트레이딩뷰의 진정한 정신에 따라, 이 스크립트의 작성자는 이를 오픈소스로 공개하여 트레이더들이 기능을 검토하고 검증할 수 있도록 했습니다. 작성자에게 찬사를 보냅니다! 이 코드는 무료로 사용할 수 있지만, 코드를 재게시하는 경우 하우스 룰이 적용된다는 점을 기억하세요.
면책사항
해당 정보와 게시물은 금융, 투자, 트레이딩 또는 기타 유형의 조언이나 권장 사항으로 간주되지 않으며, 트레이딩뷰에서 제공하거나 보증하는 것이 아닙니다. 자세한 내용은 이용 약관을 참조하세요.